
February 14, 2024
SUMMARY
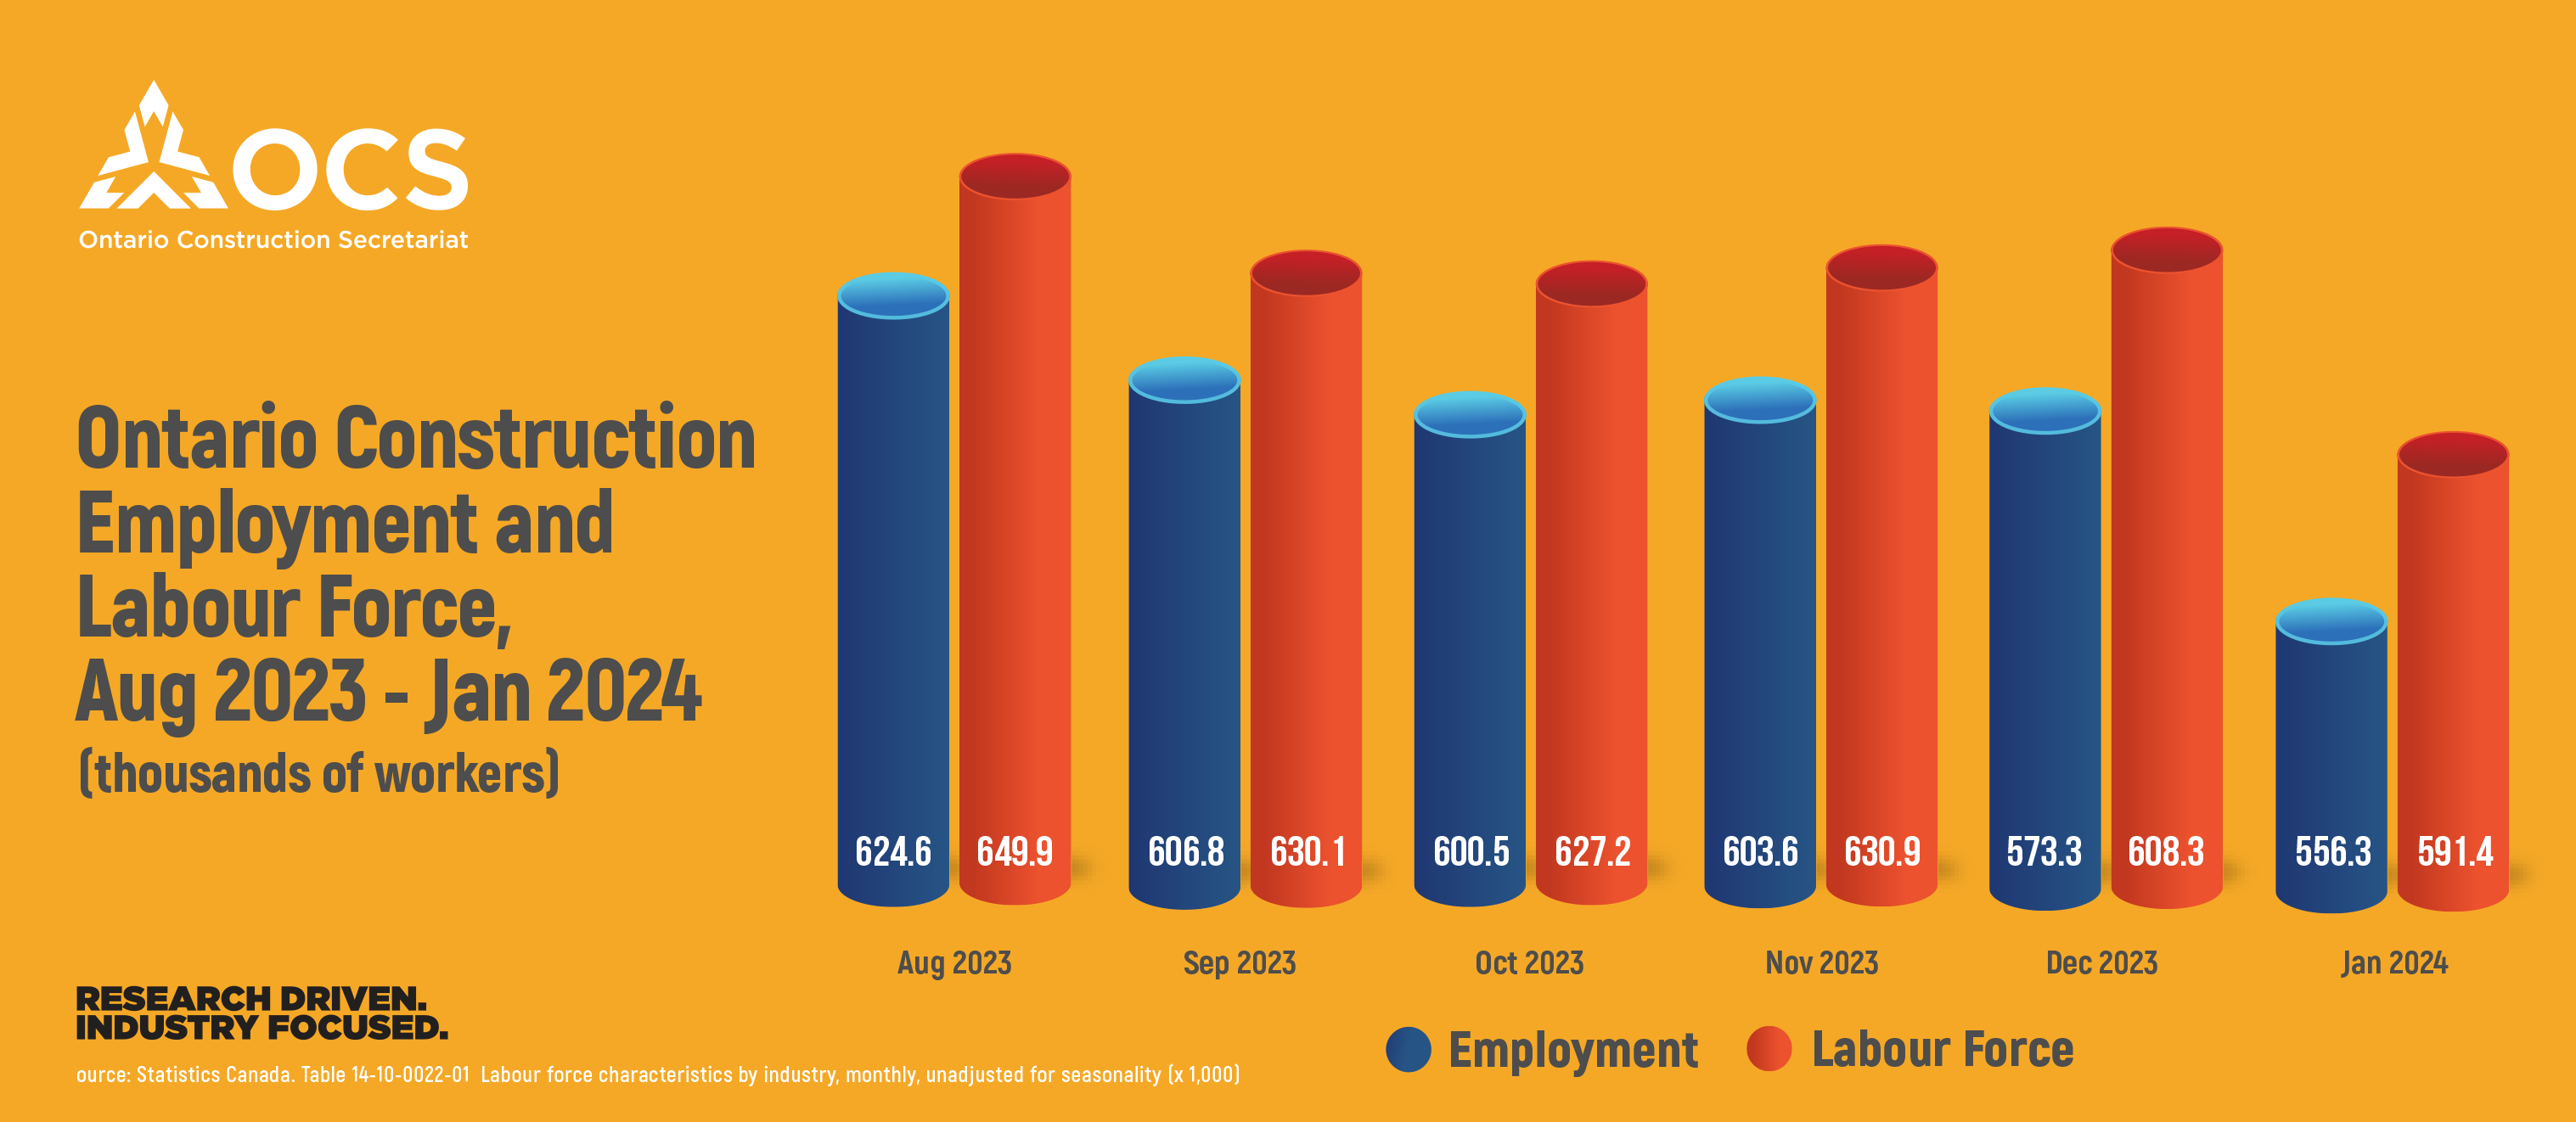
Employment and labour force fell slightly, and unemployment was up 0.1% from December
to January. Total ICI permit value was down by 37% between November and December, led by declines in the industrial and institutional sectors. Although December posted decreases, overall ICI building permit value in 2023 was higher compared to 2022.
EMPLOYMENT
From December to January, employment decreased from 573.3 thousand to 556.3 thousand, and thelabour force decreased from 608.3 thousand 591.4 thousand. Despite the decrease, it was only a -1.5% change in employment and -1.3% change in the labour force compared to January 2023. Accordingly, unemployment was up only 0.1% (5.8%-5.9%). The increase in the overall Ontario unemployment rate was much steeper, increasing from 5.5% to 6.3%.
PERMITS
Monthly Changes
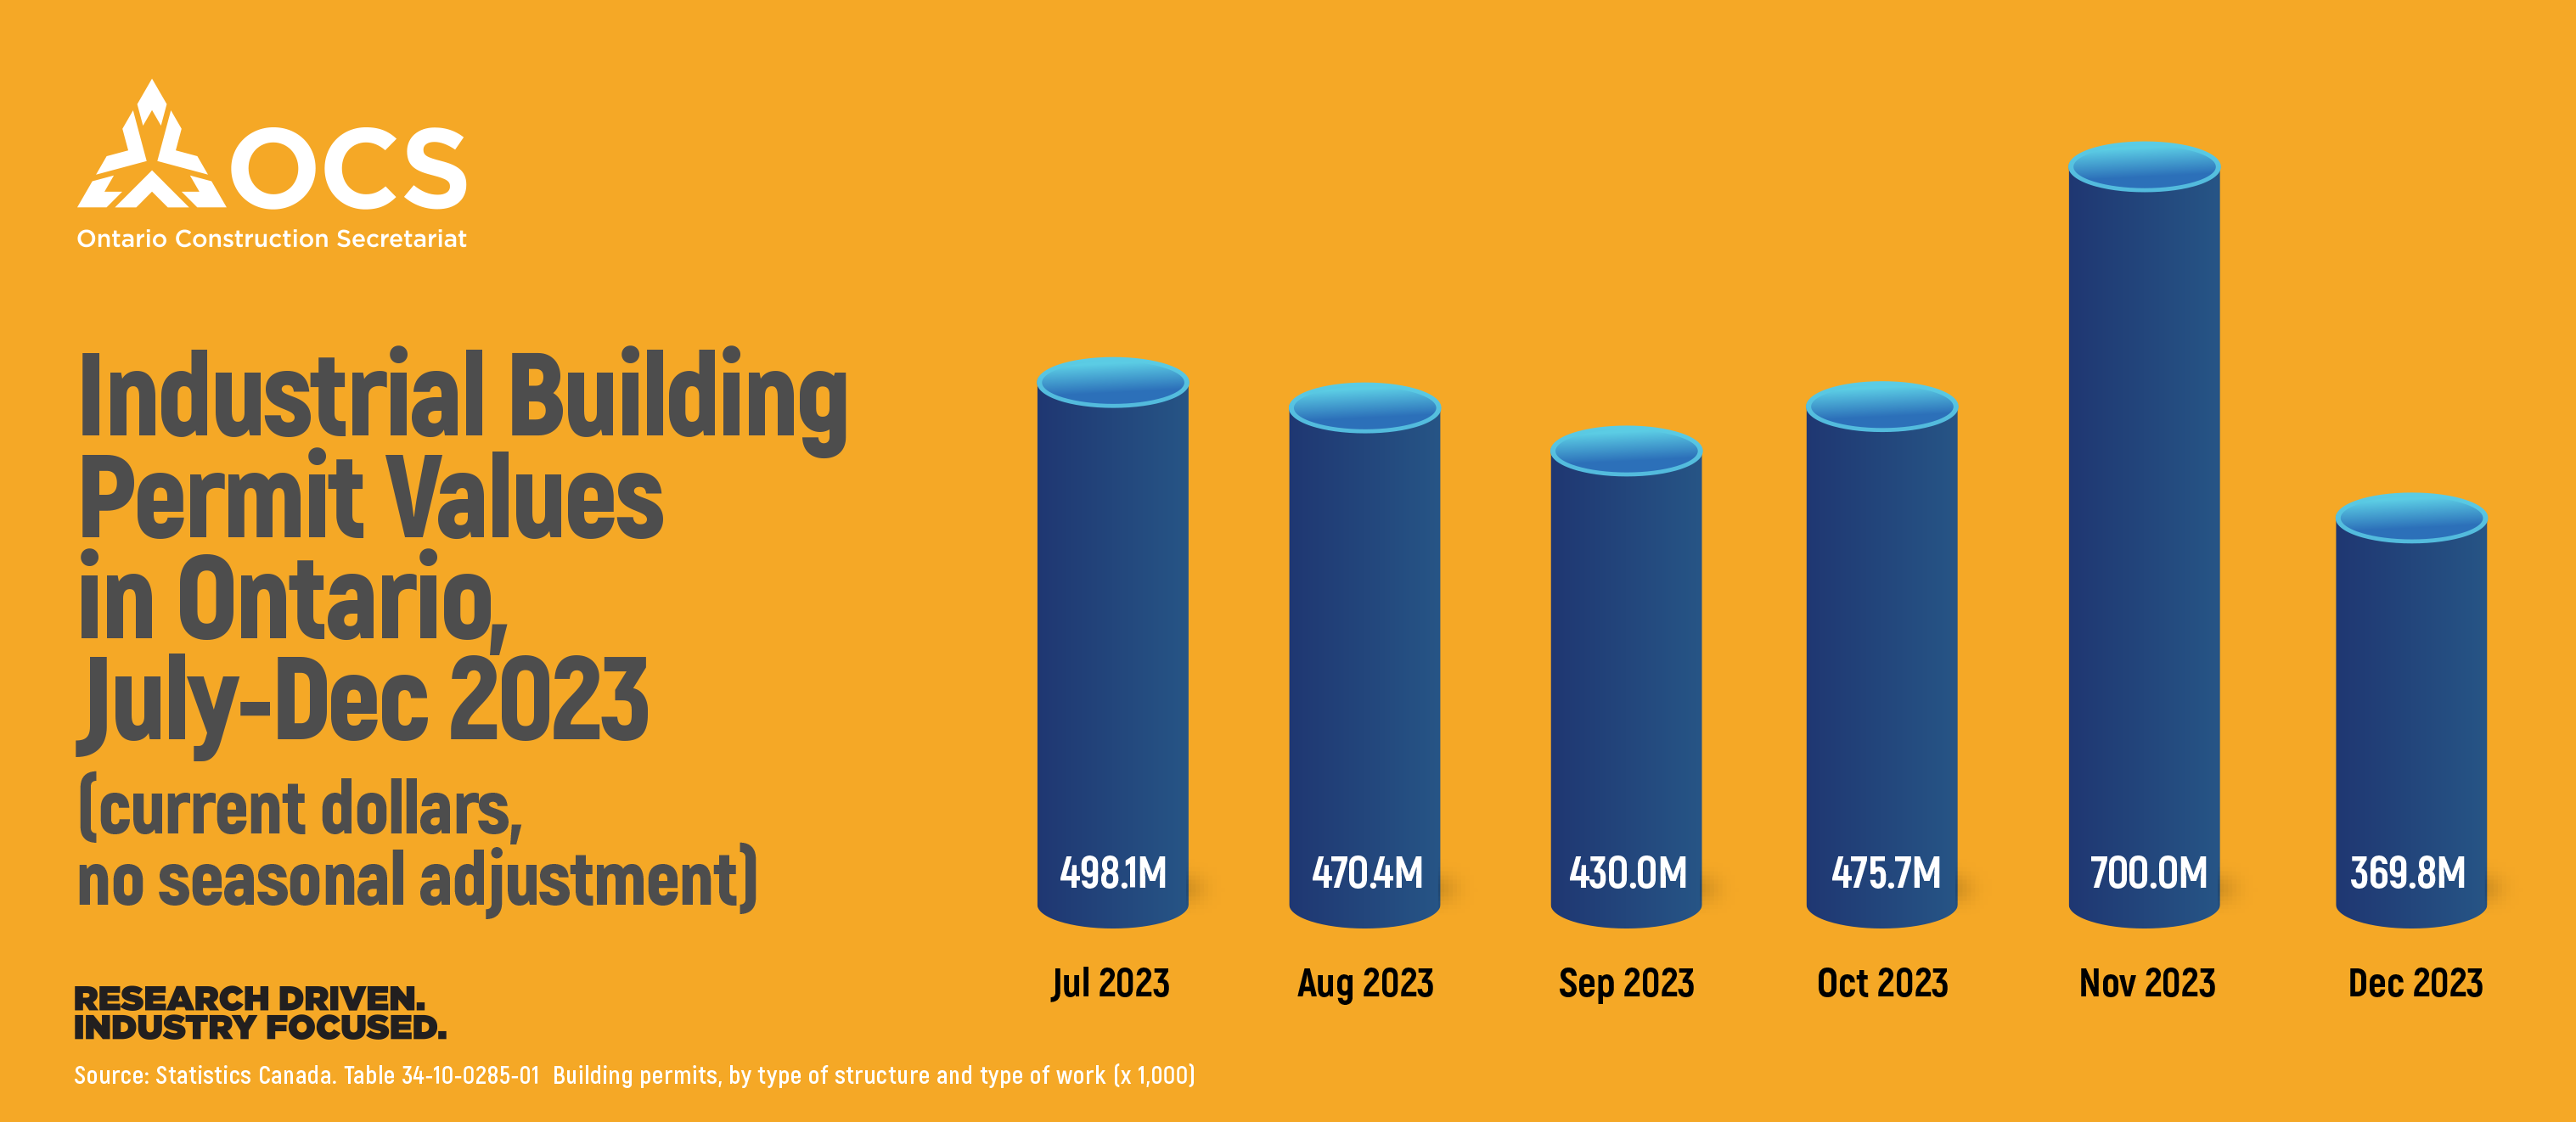
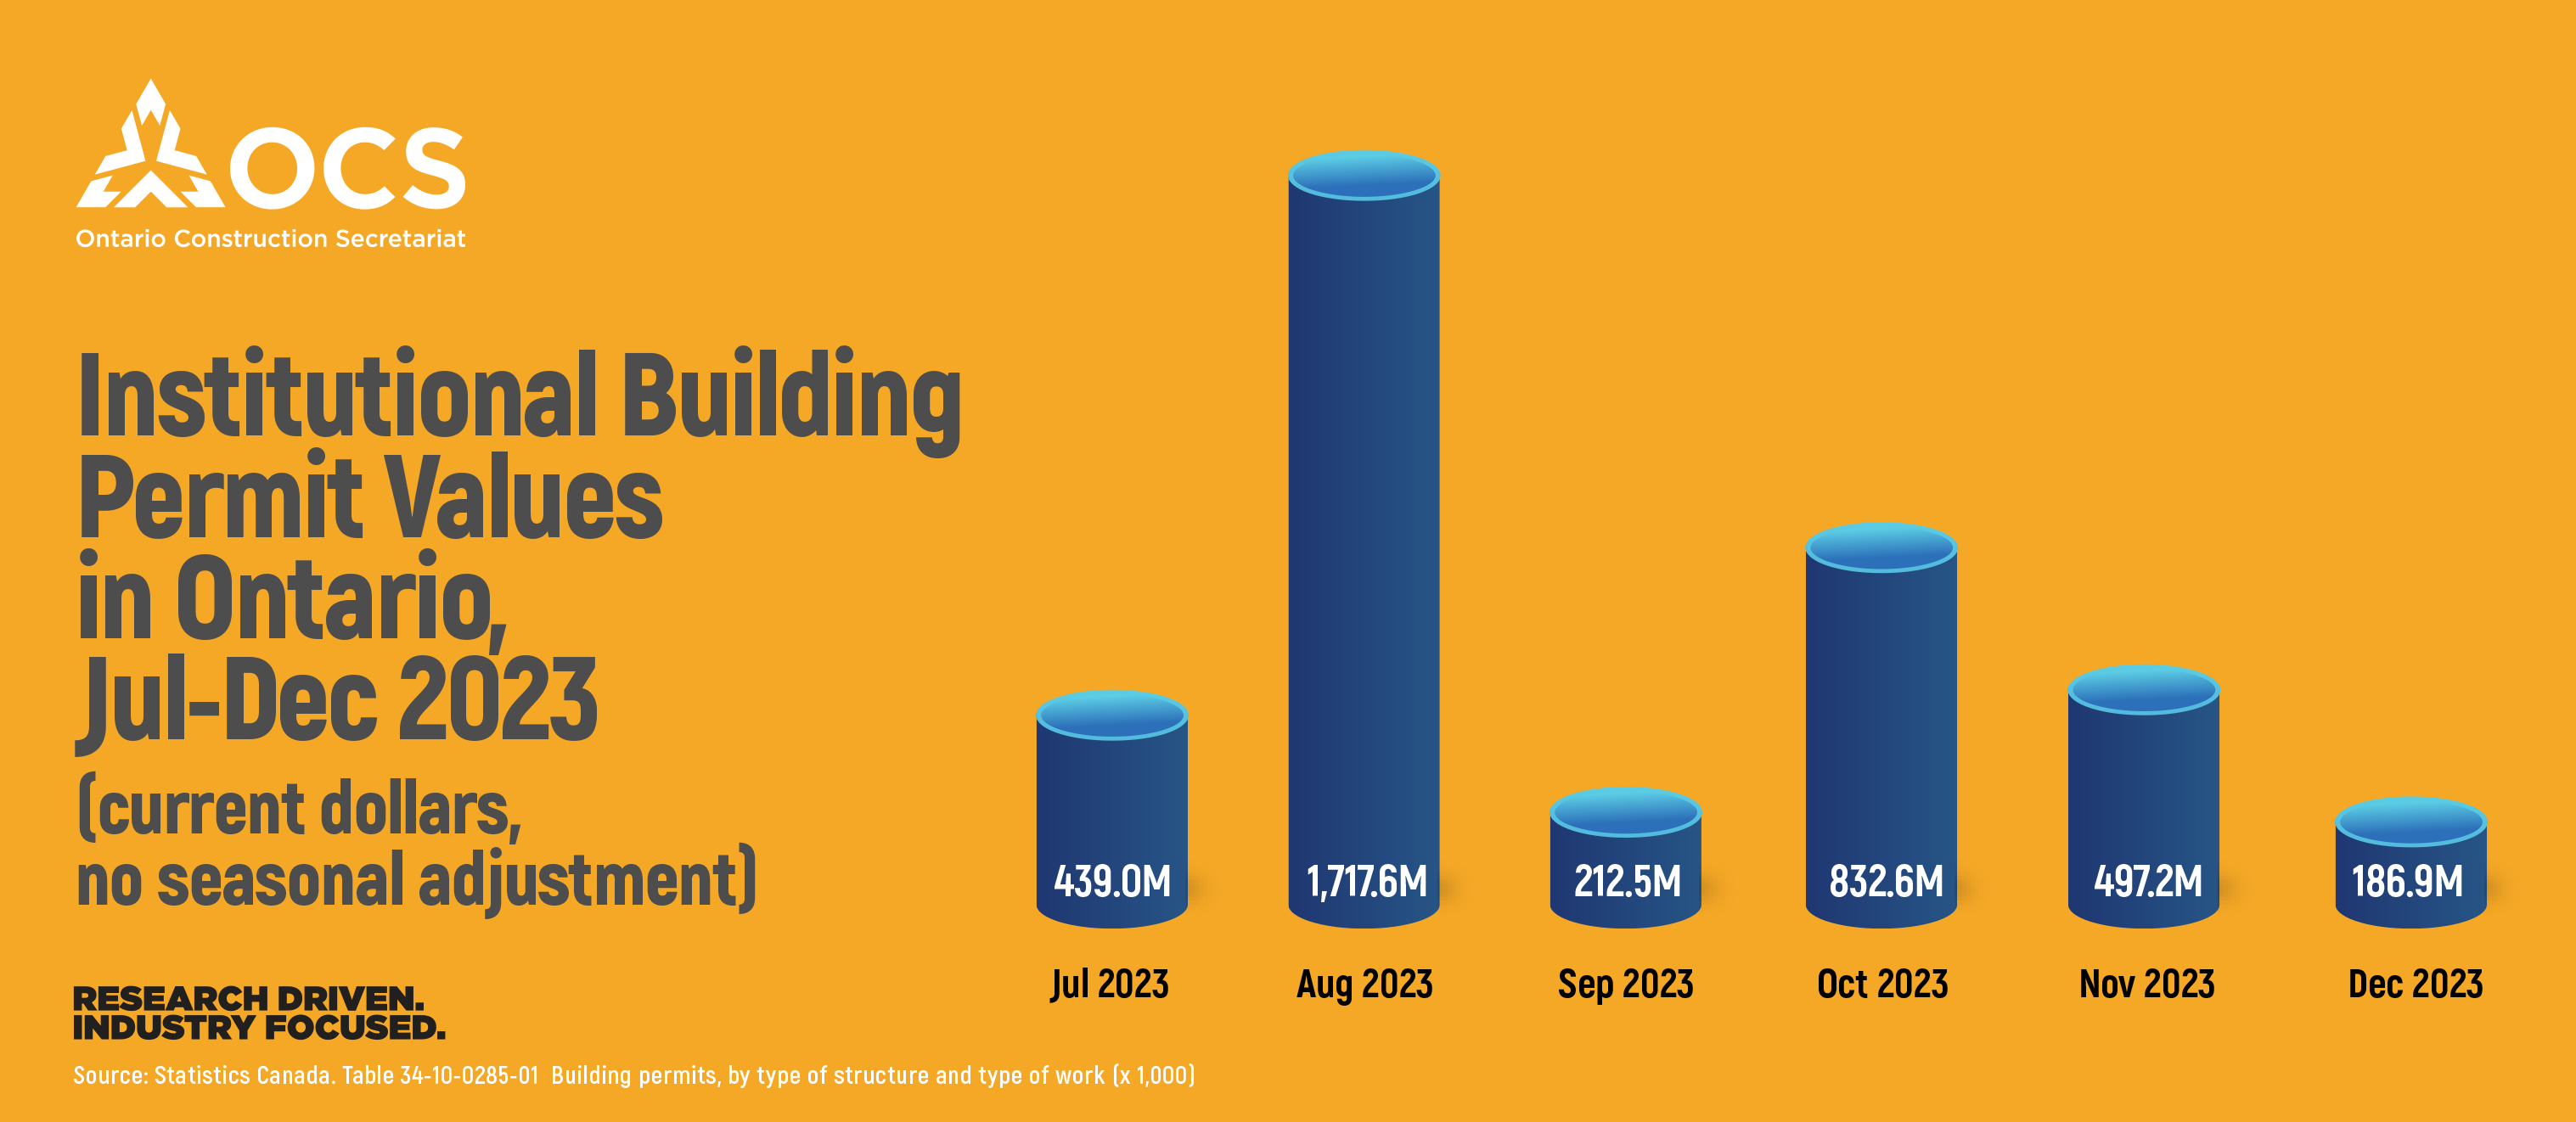
From November to December, total ICI permit value fell from $1.82 billion to $1.15 billion. This was driven by large decreases in both the industrial and institutional sectors; there was a 47% decline with industrial permit value ($700 million to $369.8 million) and a 62.4% drop in the total value of institutional building permits ($497.2 million to $186.9 million). Commercial sector permit value, however, was only down 5%, from $620 million to $588.8 million.
Yearly Changes
Year-over-year changes were also overall negative, although to a smaller degree than the month-to-month changes, with total ICI permit value down 6.9%. There was substantial variation between sectors however, the industrial sector was the only one with an increase (59%) compared to December 2022.
Quarterly Changes
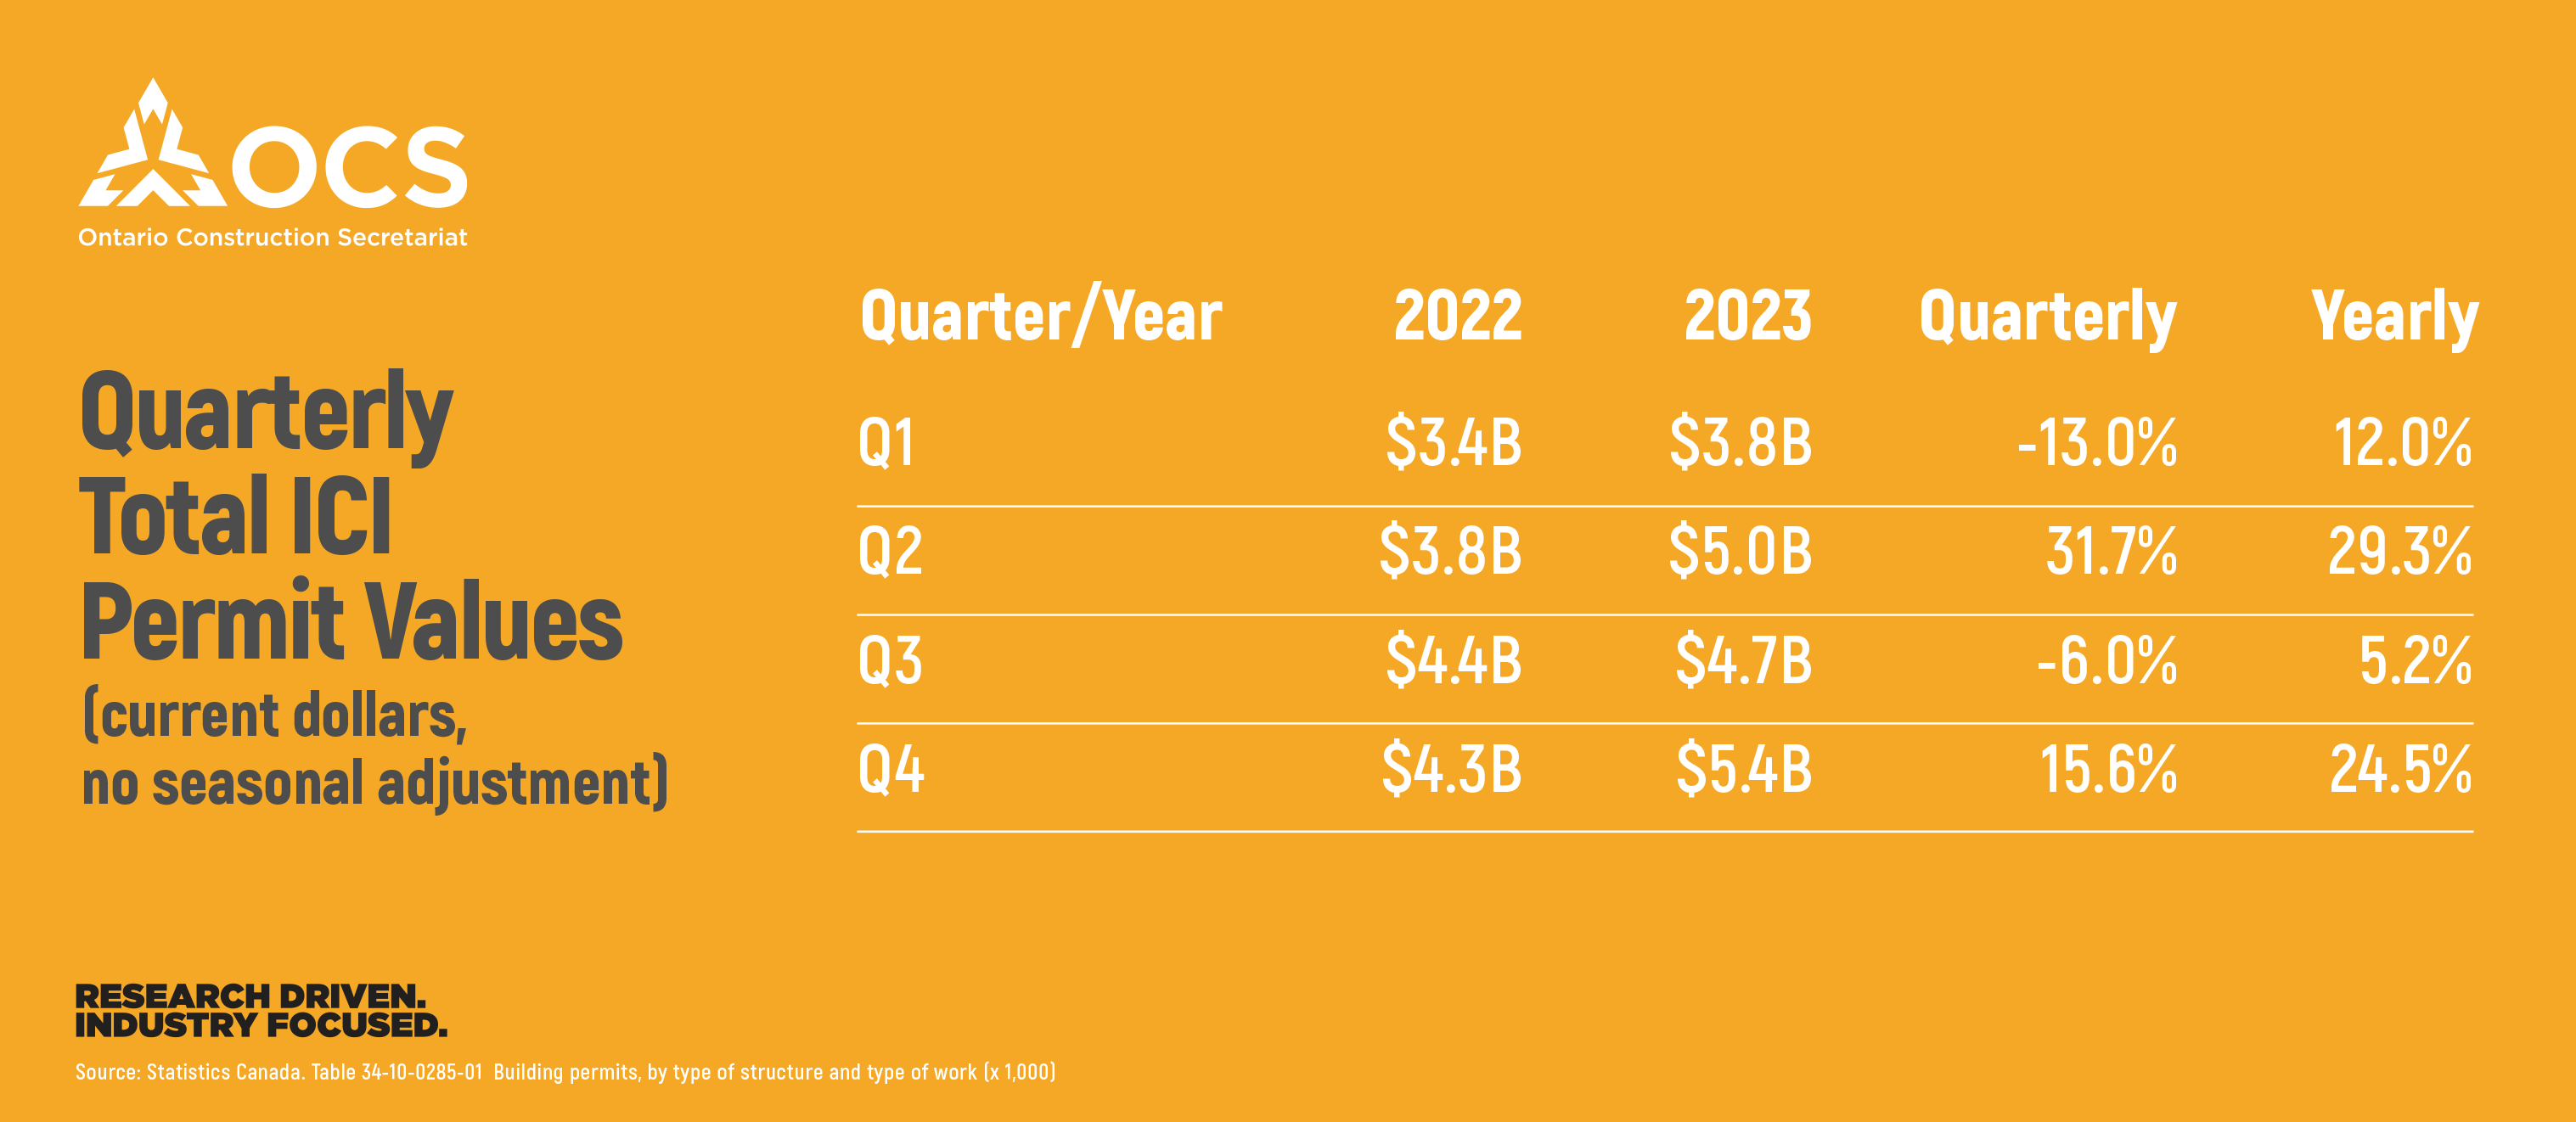
Total ICI permit value fluctuated on a quarter-to-quarter basis, however, in contrast to the negative changes between November to December, the Q4 2023 permit value was higher compared to both Q3 2023 and Q4 2022. Of note was the almost 40% quarterly increase in the industrial sector permit value ($1.1 billion – $1.5 billion), in addition to the 74% increase between Q4 2022 ($877 million) and Q4 2023.
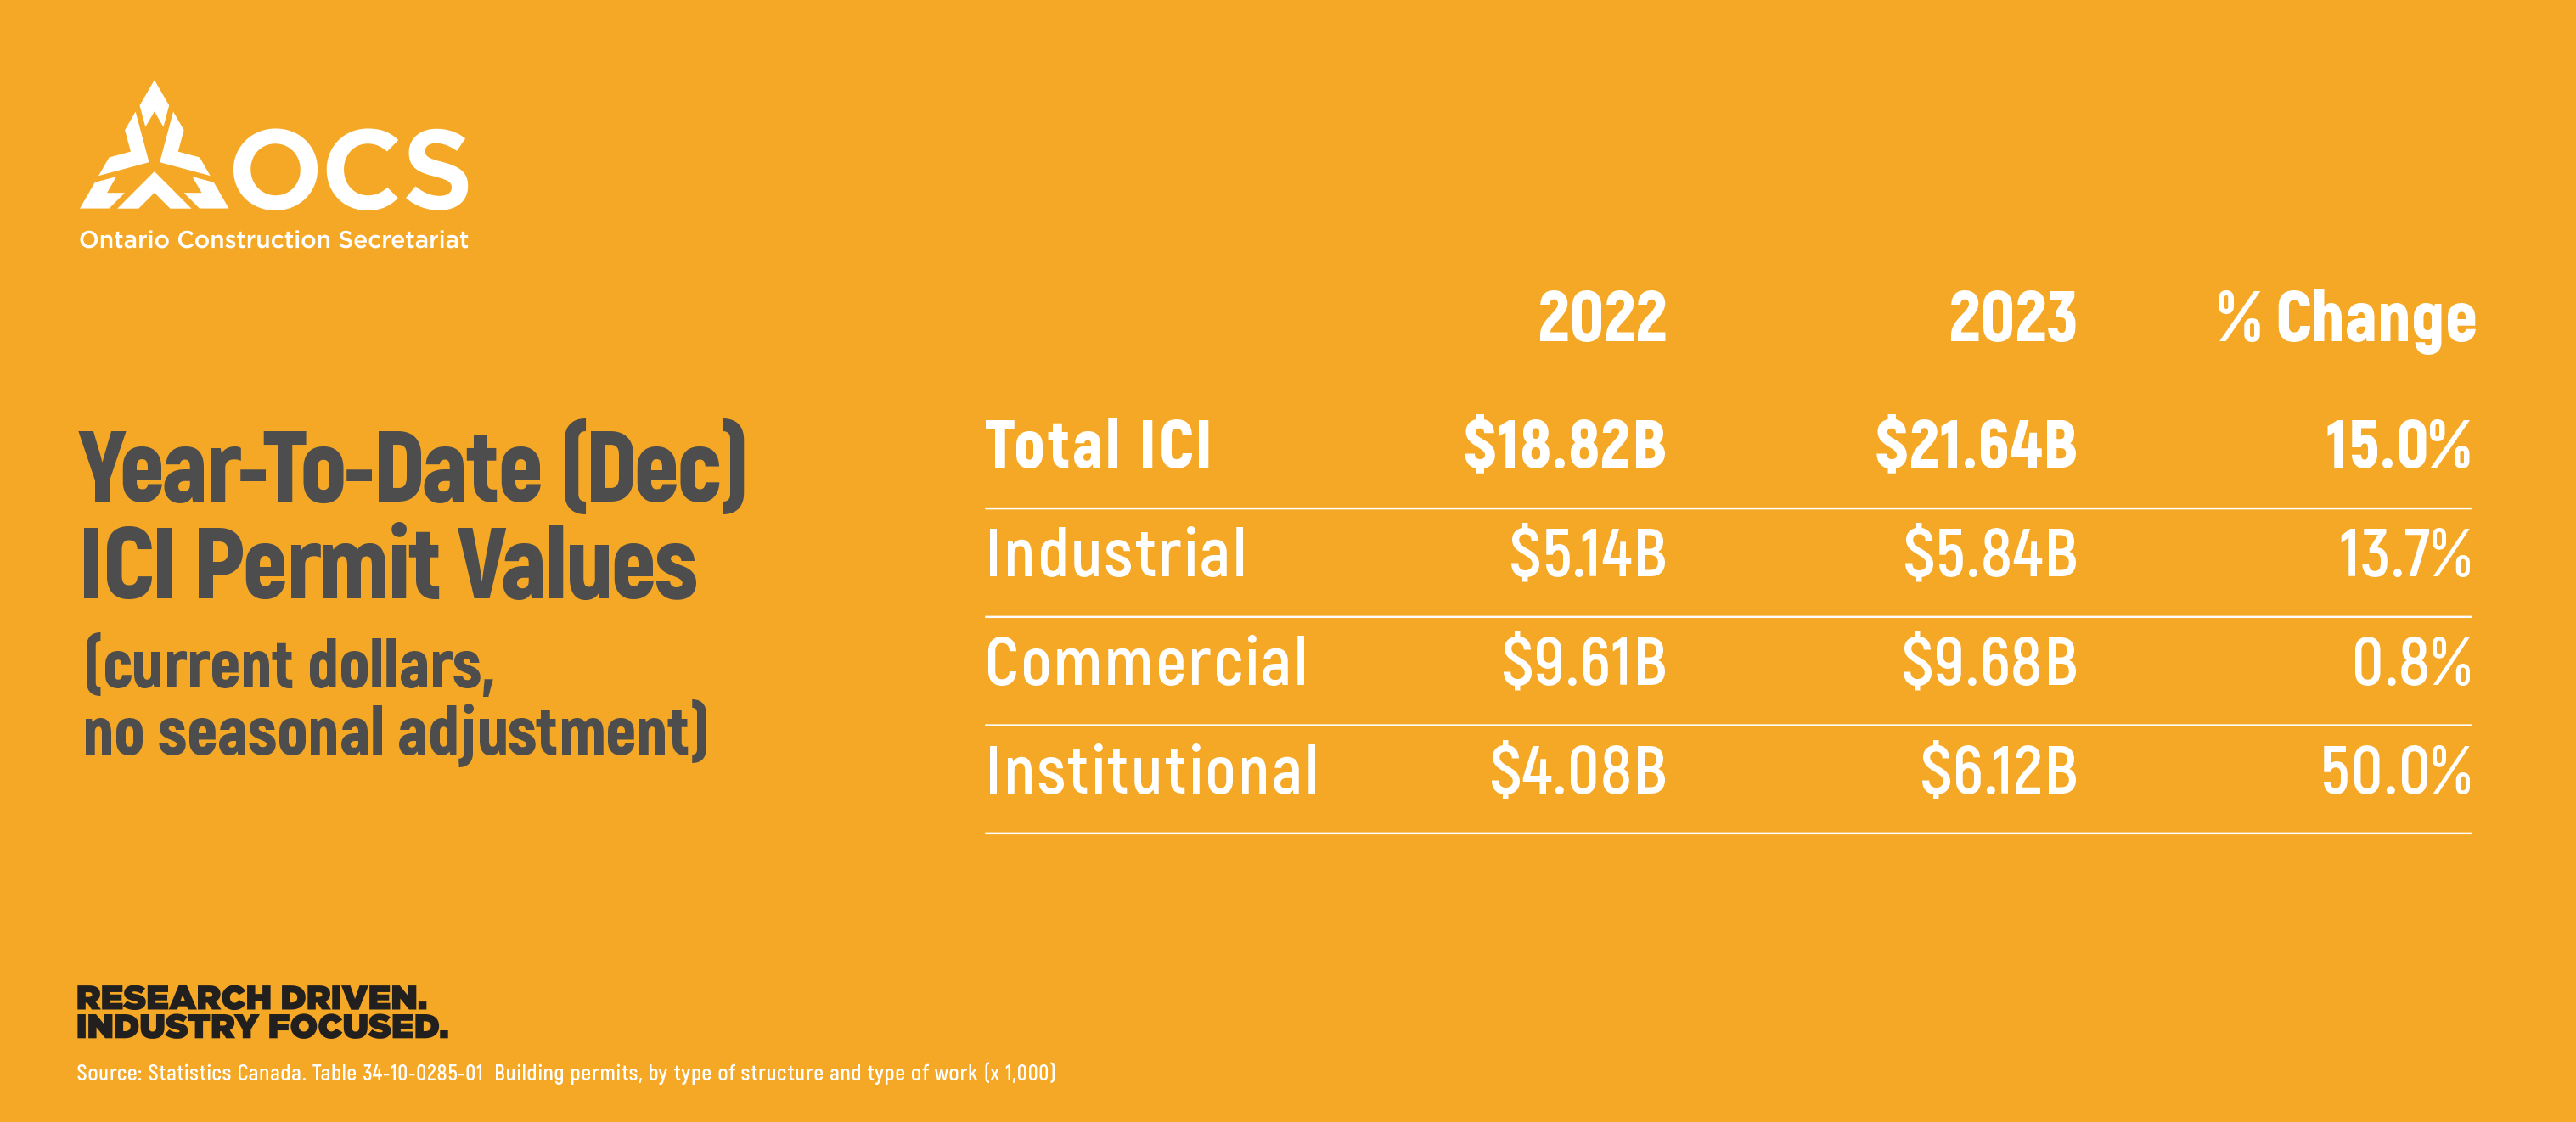
Year-to-Date
Overall, total ICI permit value in 2023 was greater than it was in 2022. Institutional permit values were up the most compared to 2022 (due to the monumental increase posted in August). Commercial building permit value on the other hand was only 0.8%. This might partly be due to the slowdown in consumer spending brought on by inflation, high interest rates, and personal debt.
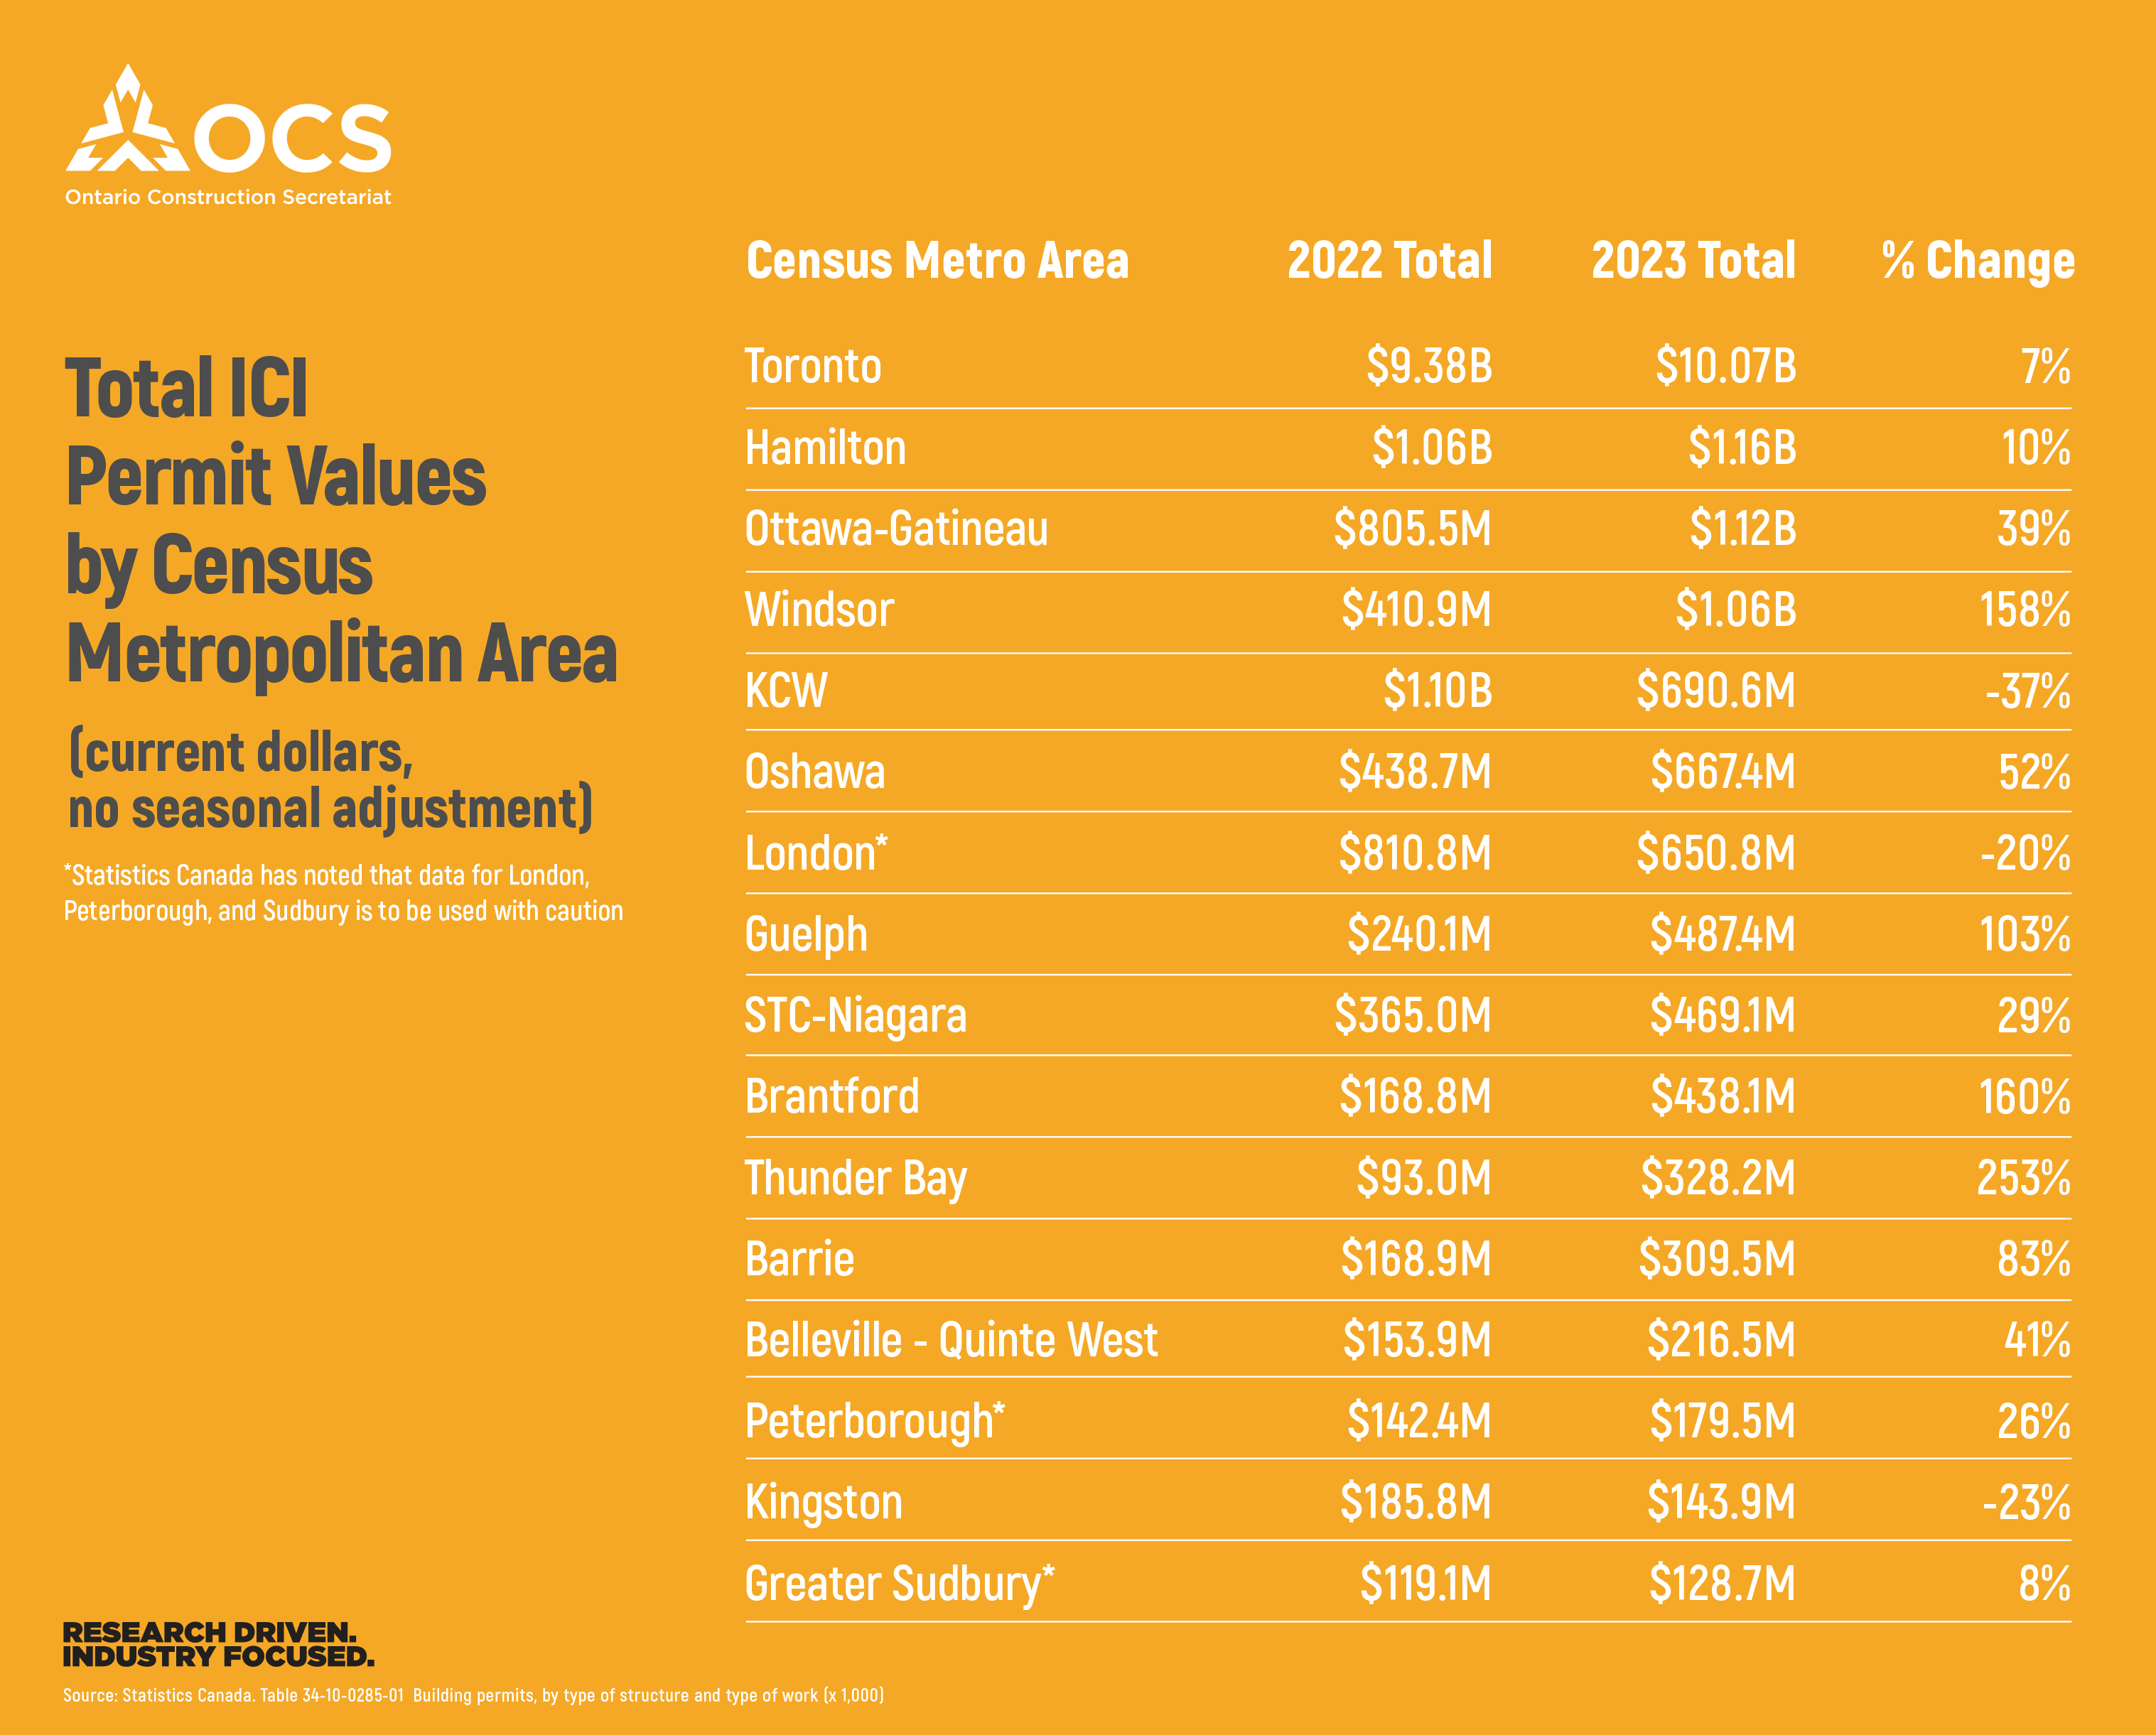
Permit Value by Census Metropolitan Region
We also briefly examined the permit value of various metropolitan areas across Ontario. Unsurprisingly, Toronto posted the highest permit value in 2023 across all sectors. Delving deeper we found that the largest total ICI permit value was in March ($1.48 billion), driven by an almost $1 billion in commercial permit value. However, the largest value for the institutional sector in particular was in August, primarily due to a major hospital renovation.
Looking at the CMAs outside Toronto, Ottawa had the highest permit value for both the commercial and institutional sectors with $549.5 million and $541.1 million respectively. Thunder Bay reported the next highest institutional permit value, owing mainly to the permit for a new correctional facility. Windsor experienced the highest industrial permit value (excluding Toronto) at $798.7 million, largely due to permitting for planned EV battery plants.
London, Kitchener-Cambridge-Waterloo (KCW), and Kingston each had lower permit values than in 2022. However, 2022 showed somewhat higher values compared to the historical levels.
_____________________________
FOR MORE INFORMATION, CONTACT:
Ali Ahmad
Research Analyst
Ontario Construction Secretariat (OCS)
180 Attwell Drive, Suite 360, Toronto, ON M9W 6A9
P 416.620.5210 ext. 222
aahmad@iciconstruction.com