
February 19, 2025
SUMMARY
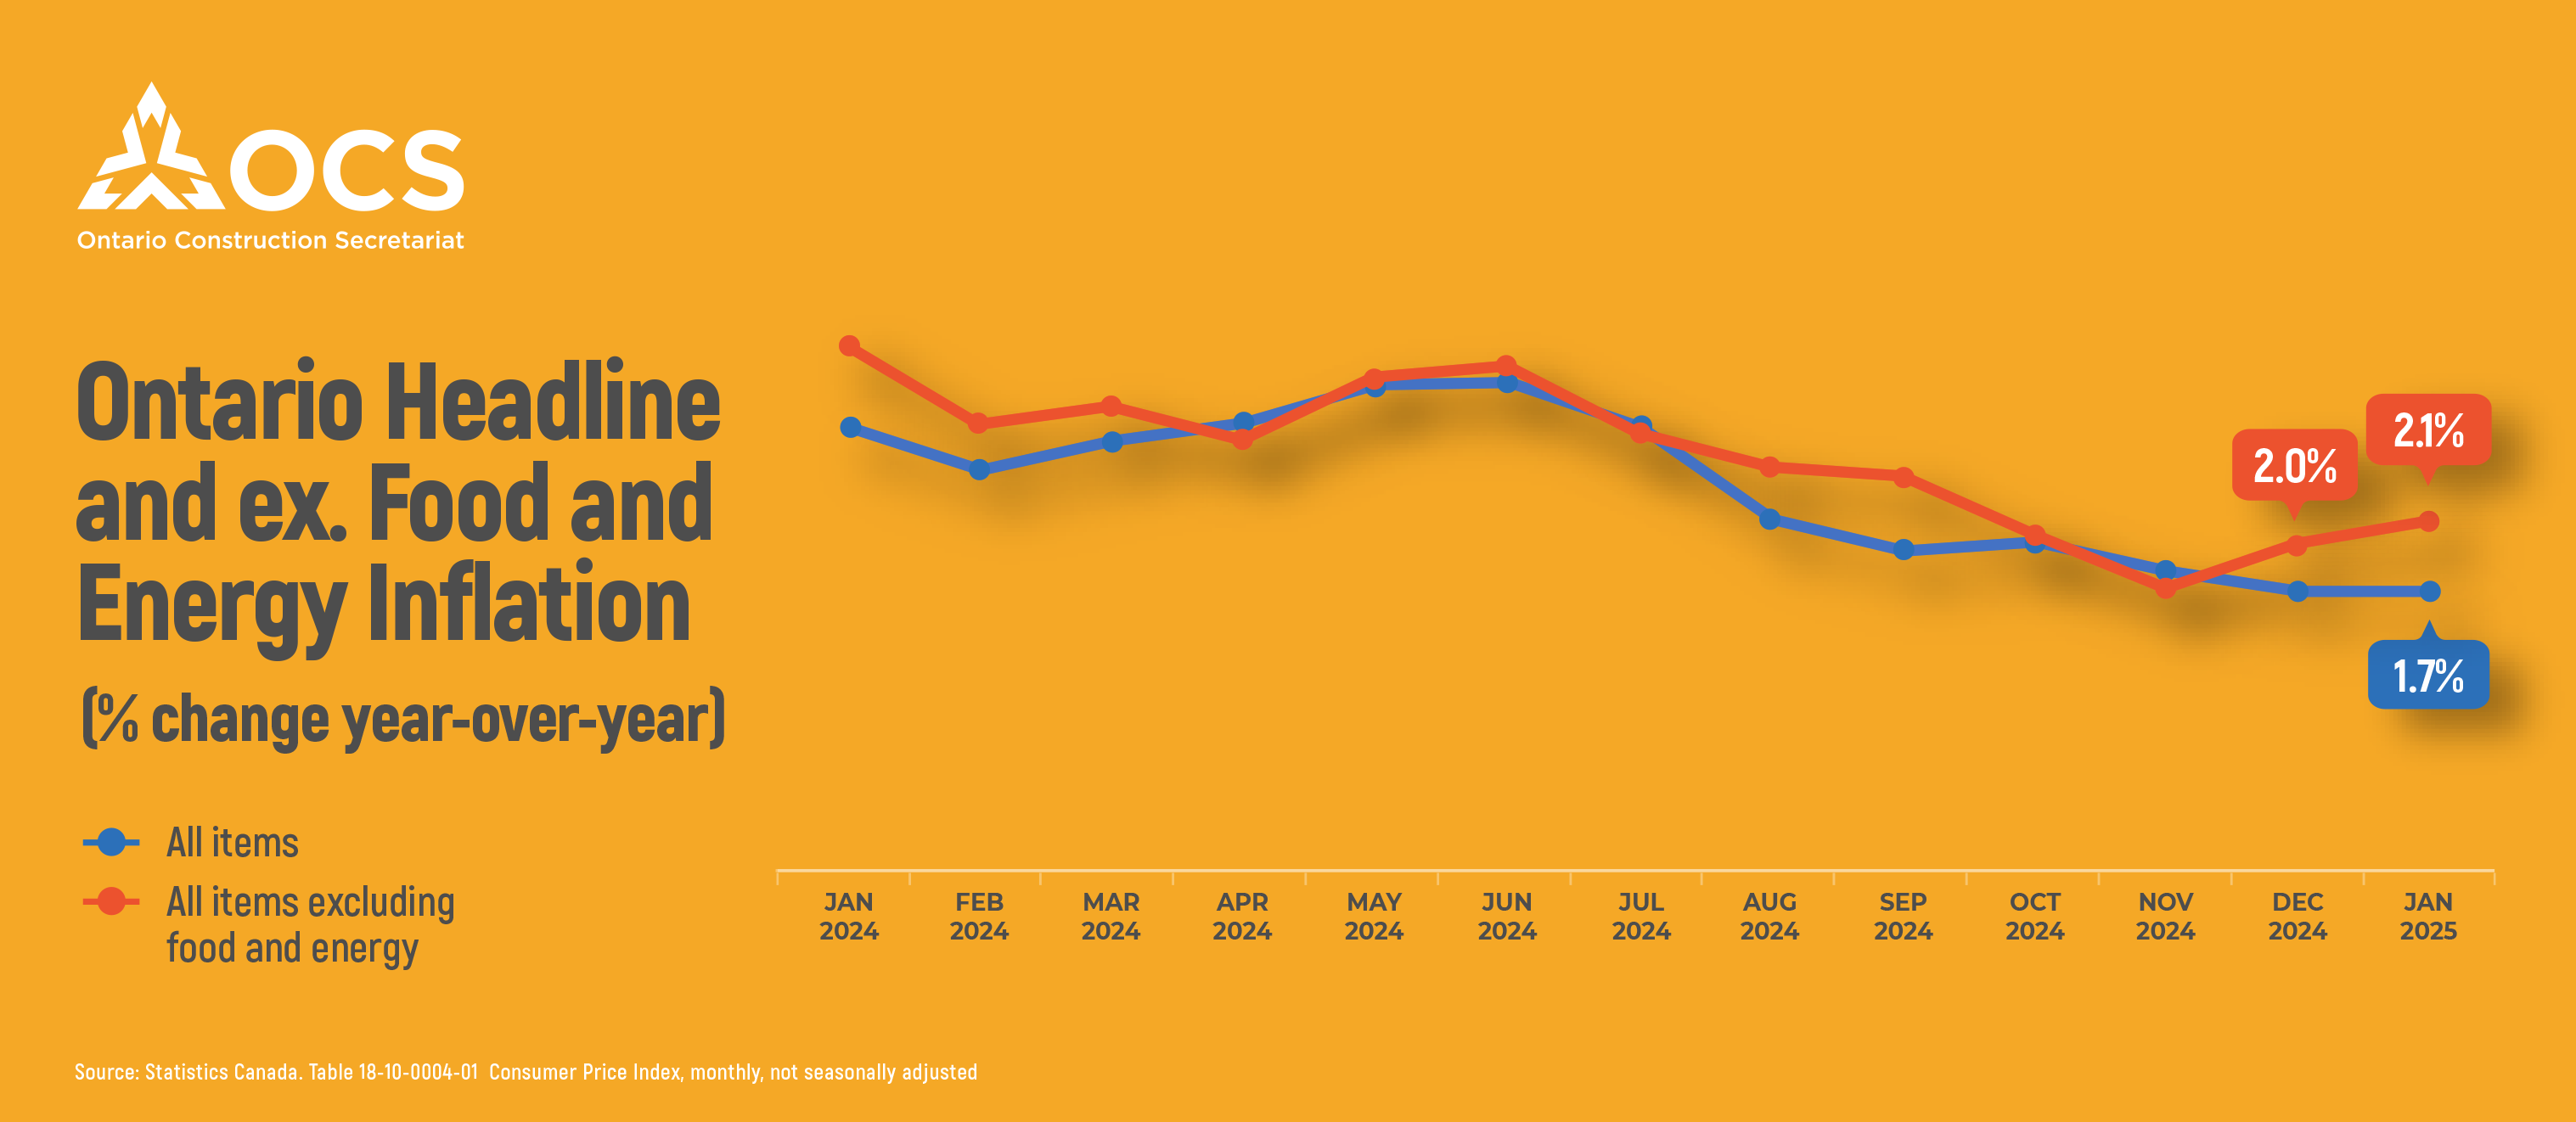
Ontario headline inflation remained at 1.7% annual inflation, while inflation excluding food and energy ticked up from 2% to 2.1%. The composition of inflation looked a lot different compared to the prior month. Energy, food, and goods inflation all changed direction compared to the pre-existing trends.
CONSUMER PRICE INDEX INFLATION
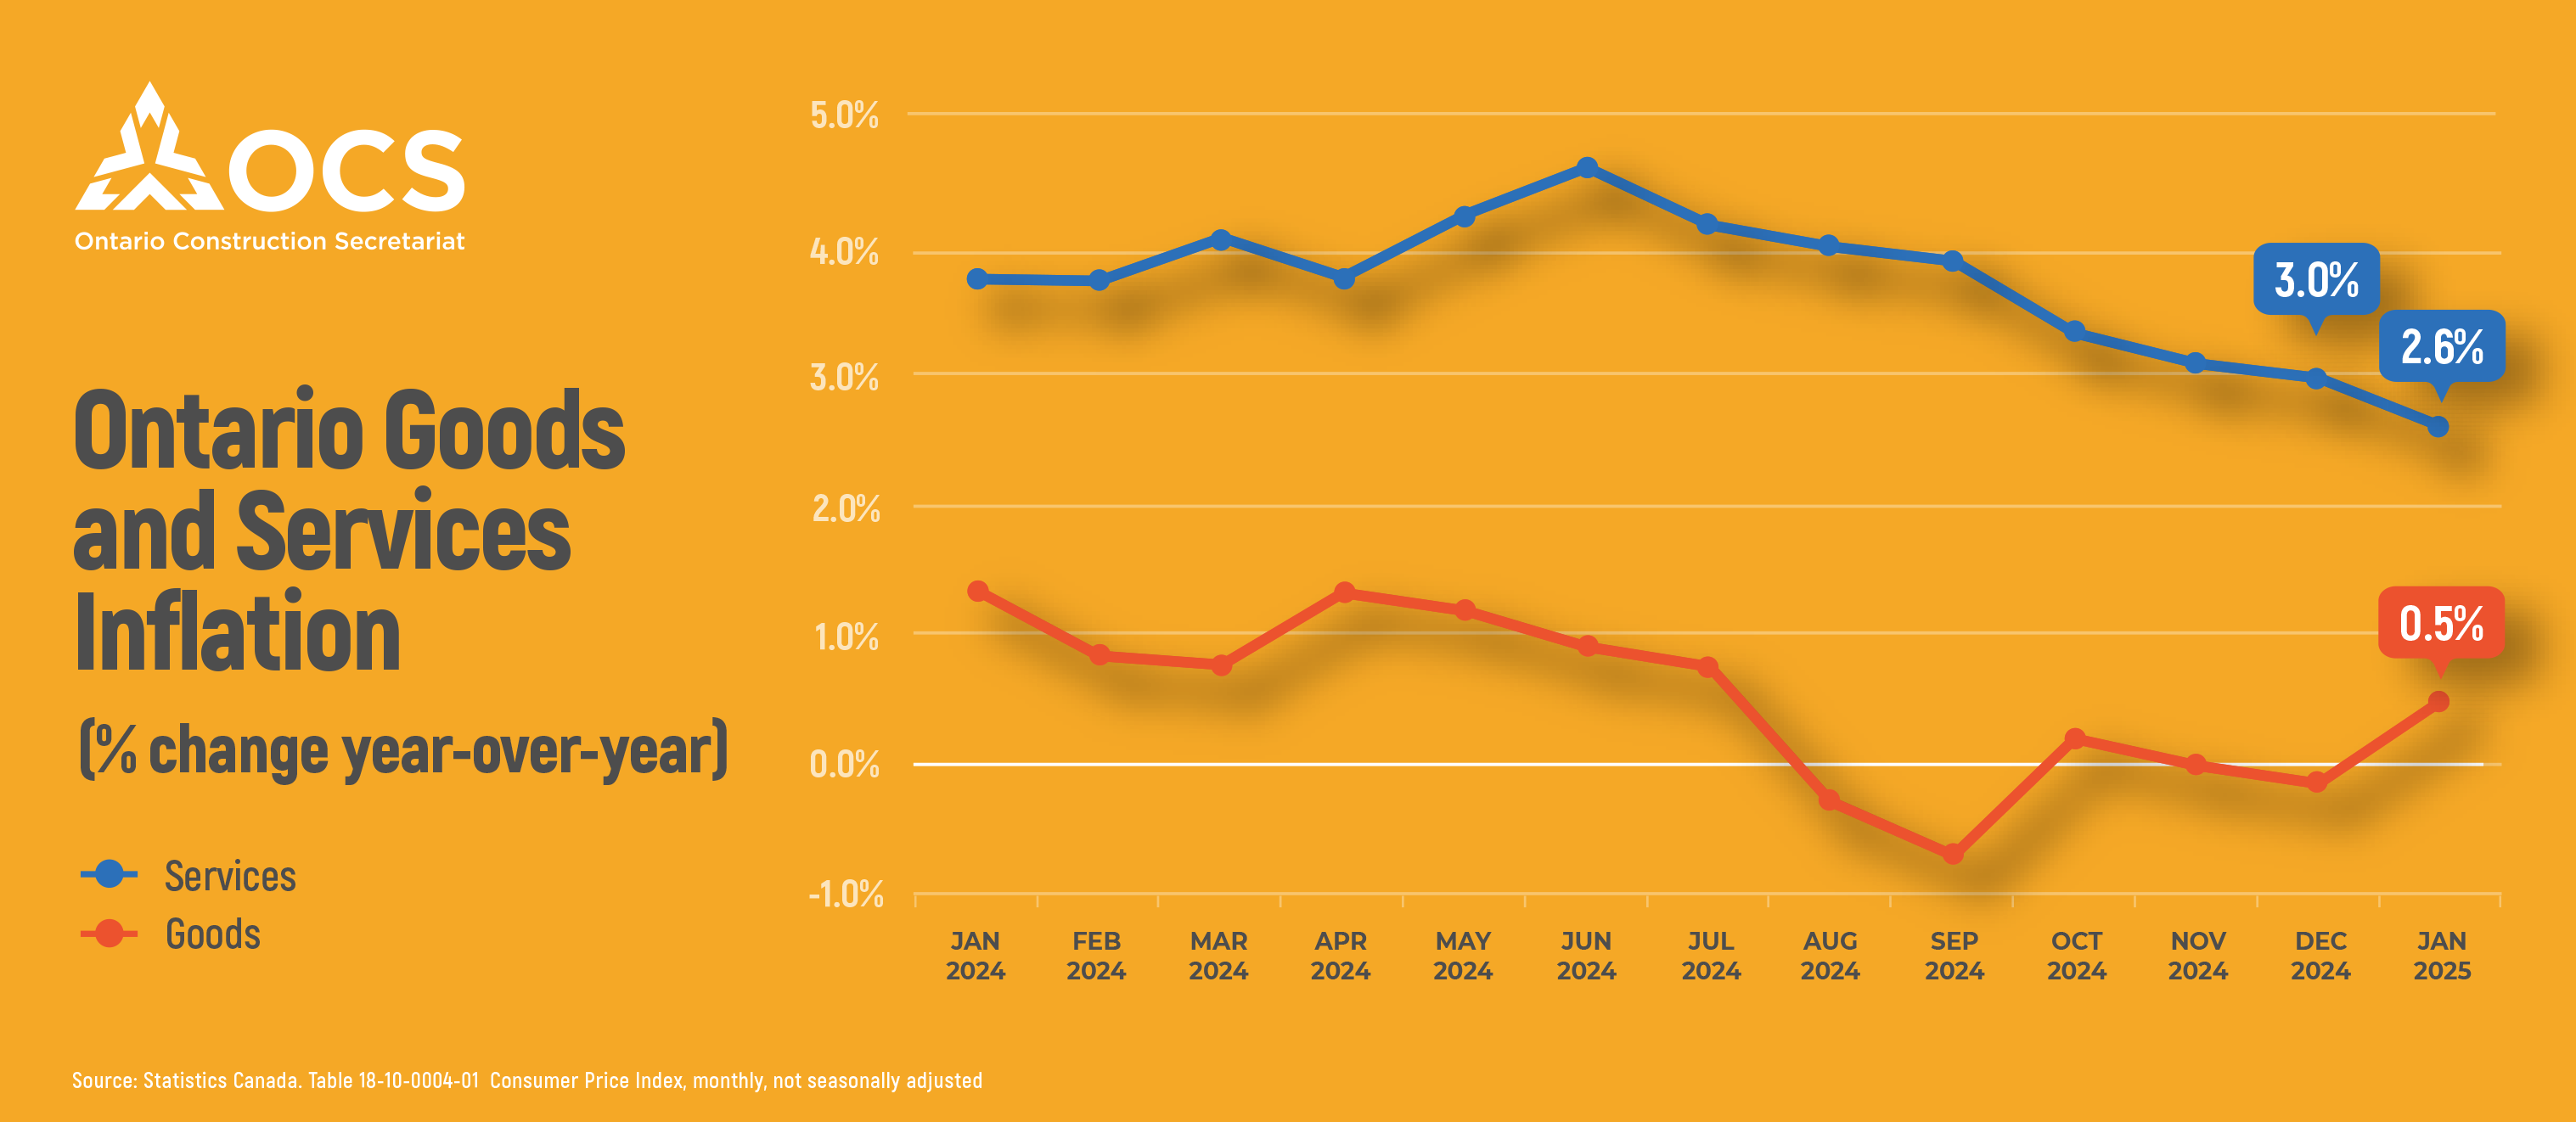
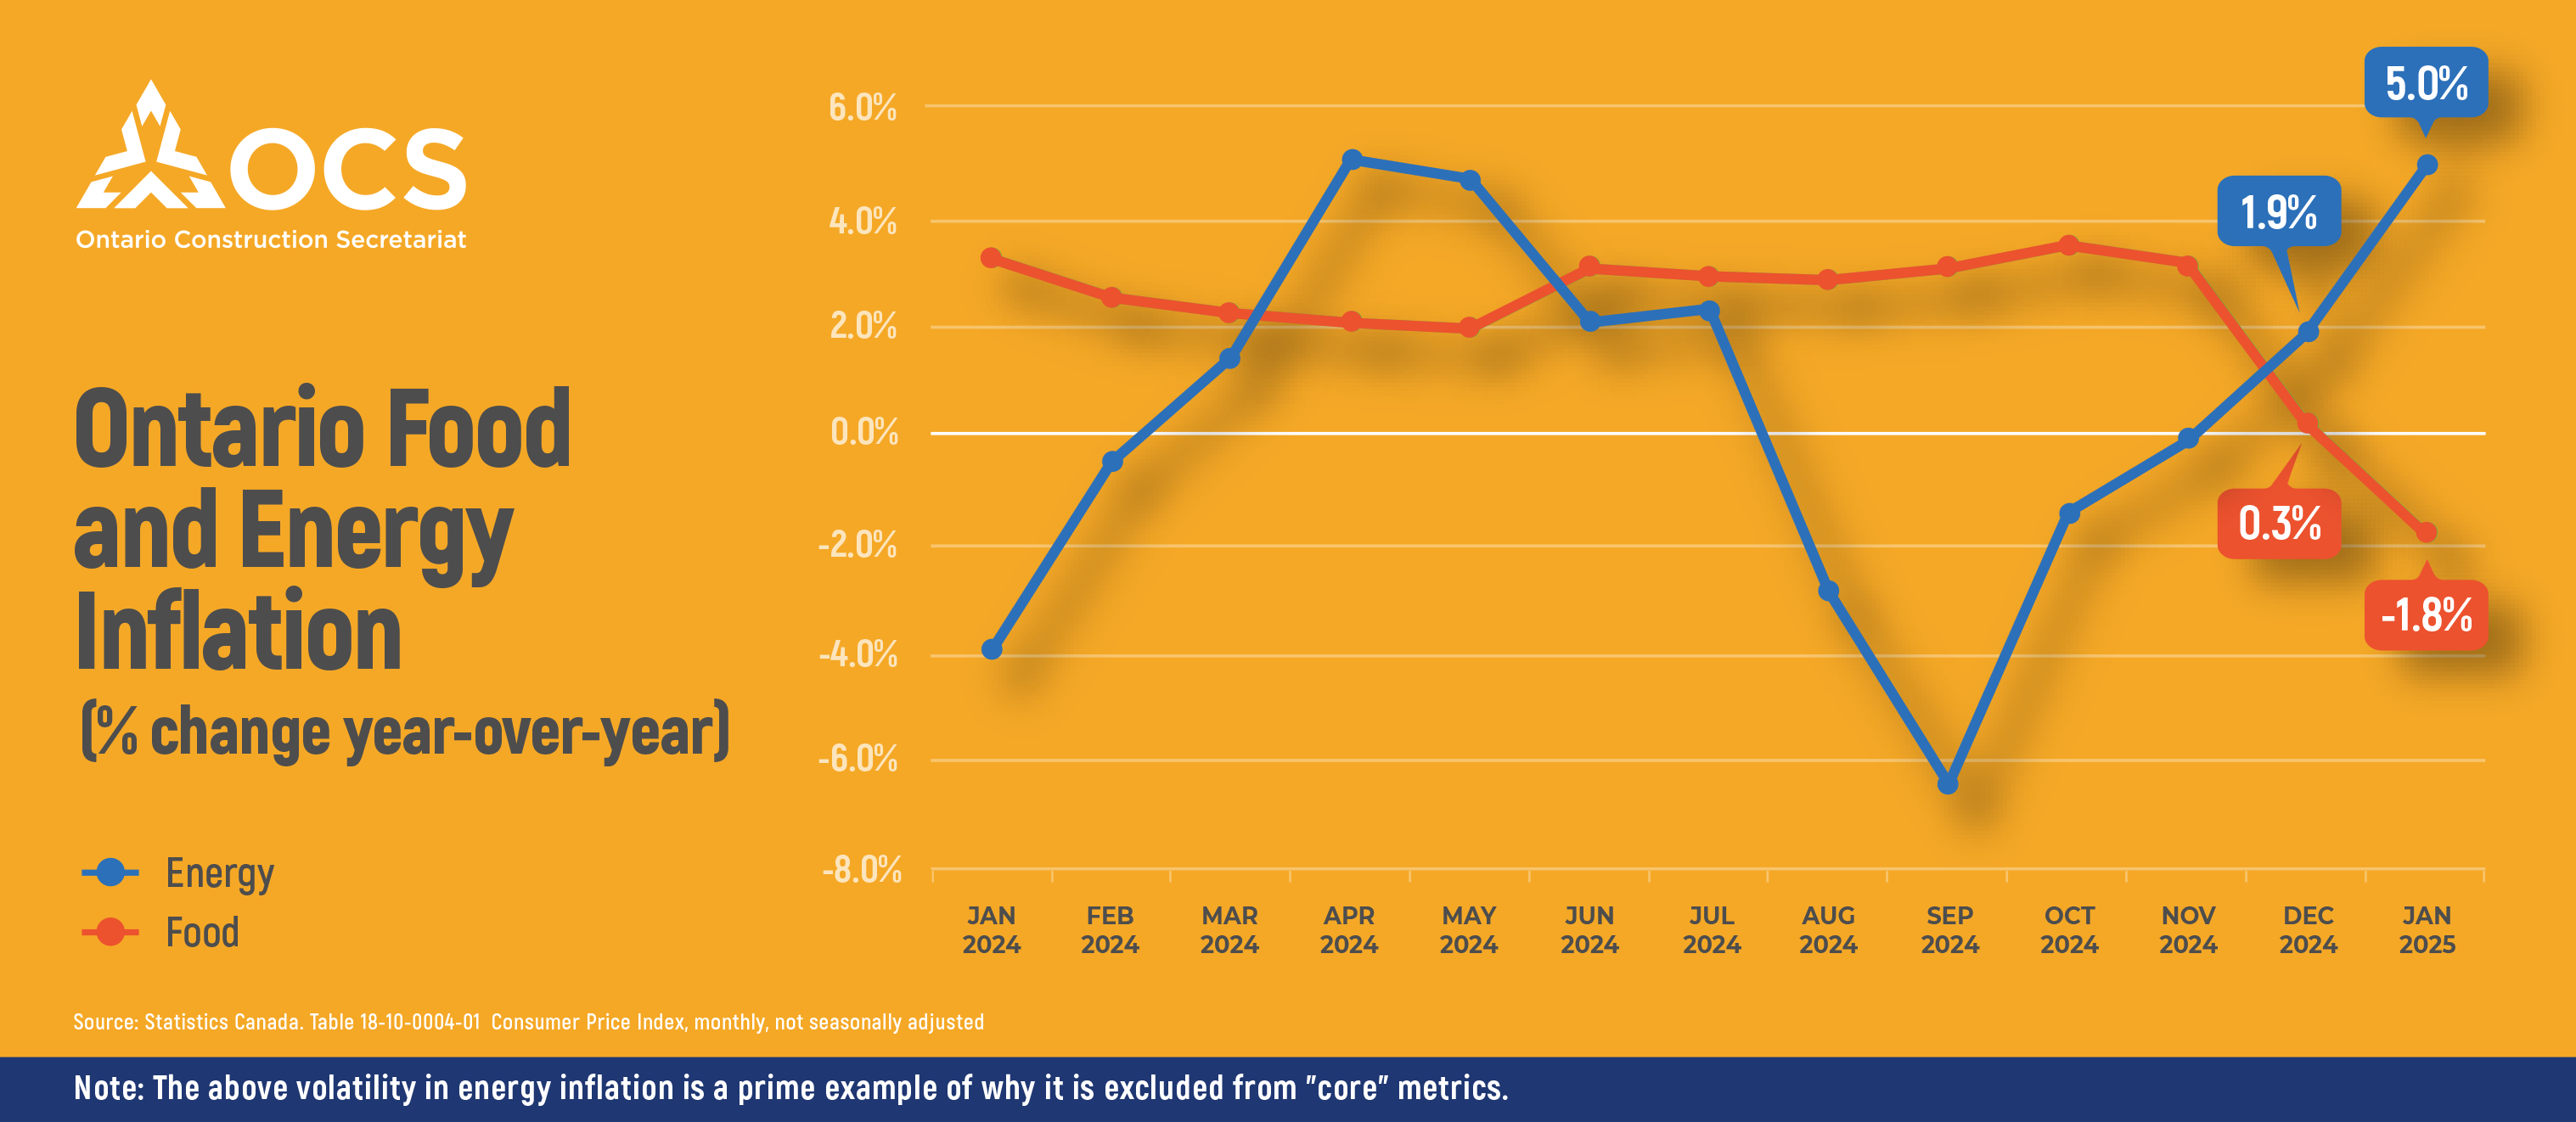
Ontario’s headline inflation was unchanged at 1.7% y/y between December and January, and inflation excluding food and energy inched up from 2% y/y to 2.1% y/y. In recent years, the source of this persistent inflation was concentrated in the services sector, but since June 2024 it has been on a consistently downward trend, reaching 2.6% y/y in January. This is the first time since August 2021 that services inflation has been below 3%. In contrast, it was actually goods inflation which increased (from -0.1% y/y to 0.5% y/y) after a slew of negative or near-zero inflation since August 2024. Taking a look at the broader composition of the headline reading also showed a reversal for energy and food. Energy inflation went up to a hefty 5% y/y (previously 1.9% y/y), while food inflation was -1.8% y/y (the first negative reading since May 2017!).
Note: Inflation excluding food and energy, a measure of “core” inflation, is often of interest since food and energy prices tend to be volatile and may not represent average underlying prices trends.
_____________________________
FOR MORE INFORMATION, CONTACT:
Ali Ahmad
Research Analyst
Ontario Construction Secretariat (OCS)
180 Attwell Drive, Suite 360, Toronto, ON M9W 6A9
P 416.620.5210 ext. 222
aahmad@iciconstruction.com