
June 19, 2025
SUMMARY
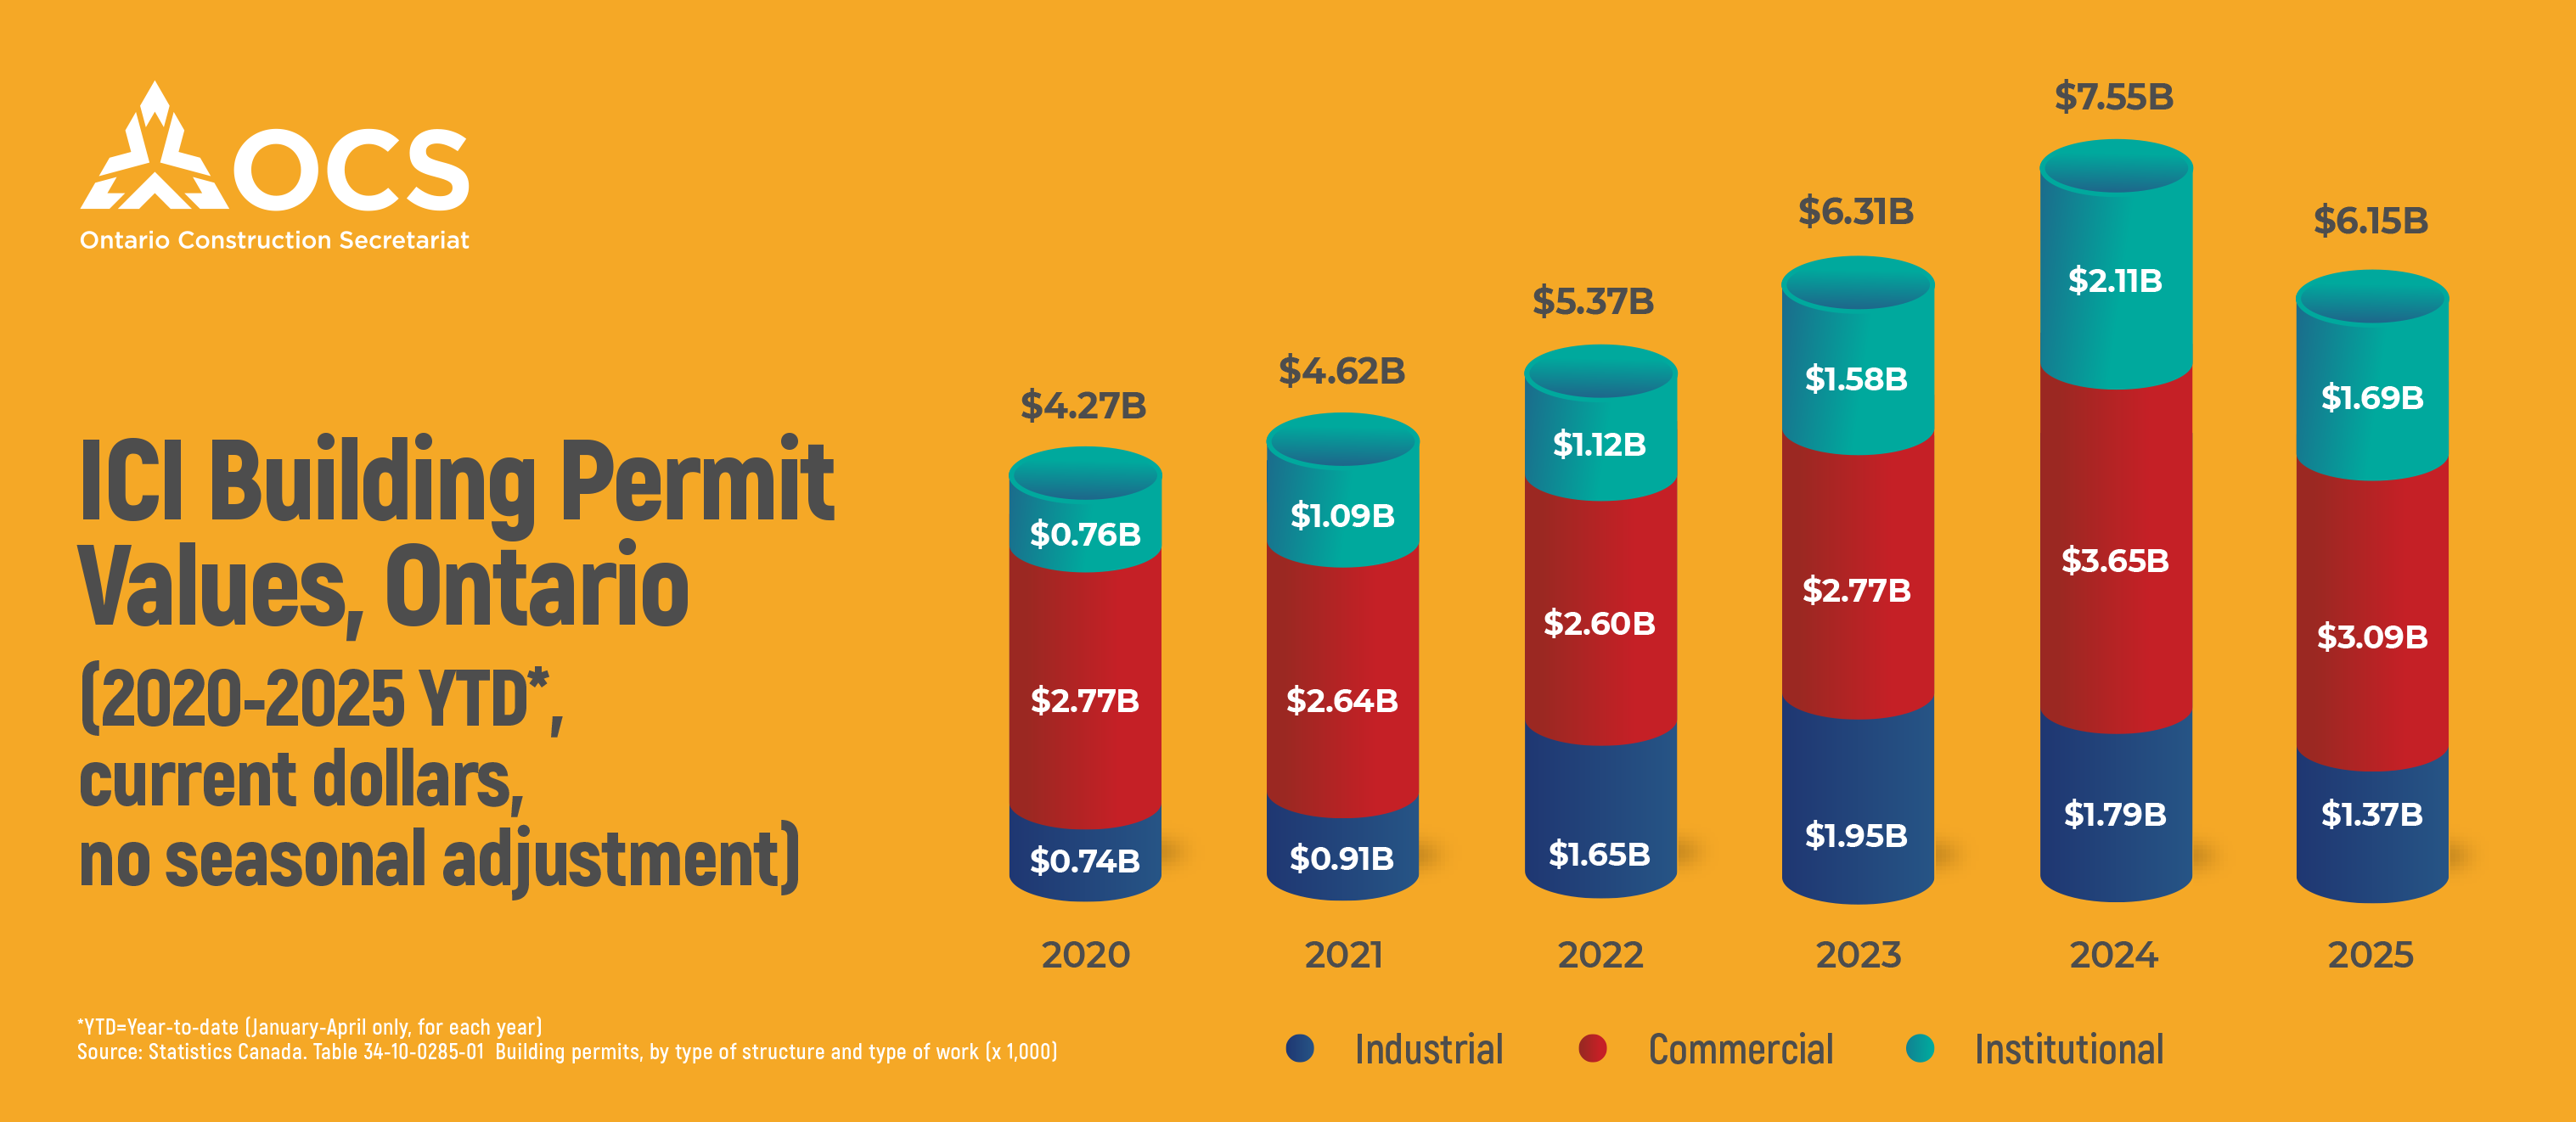
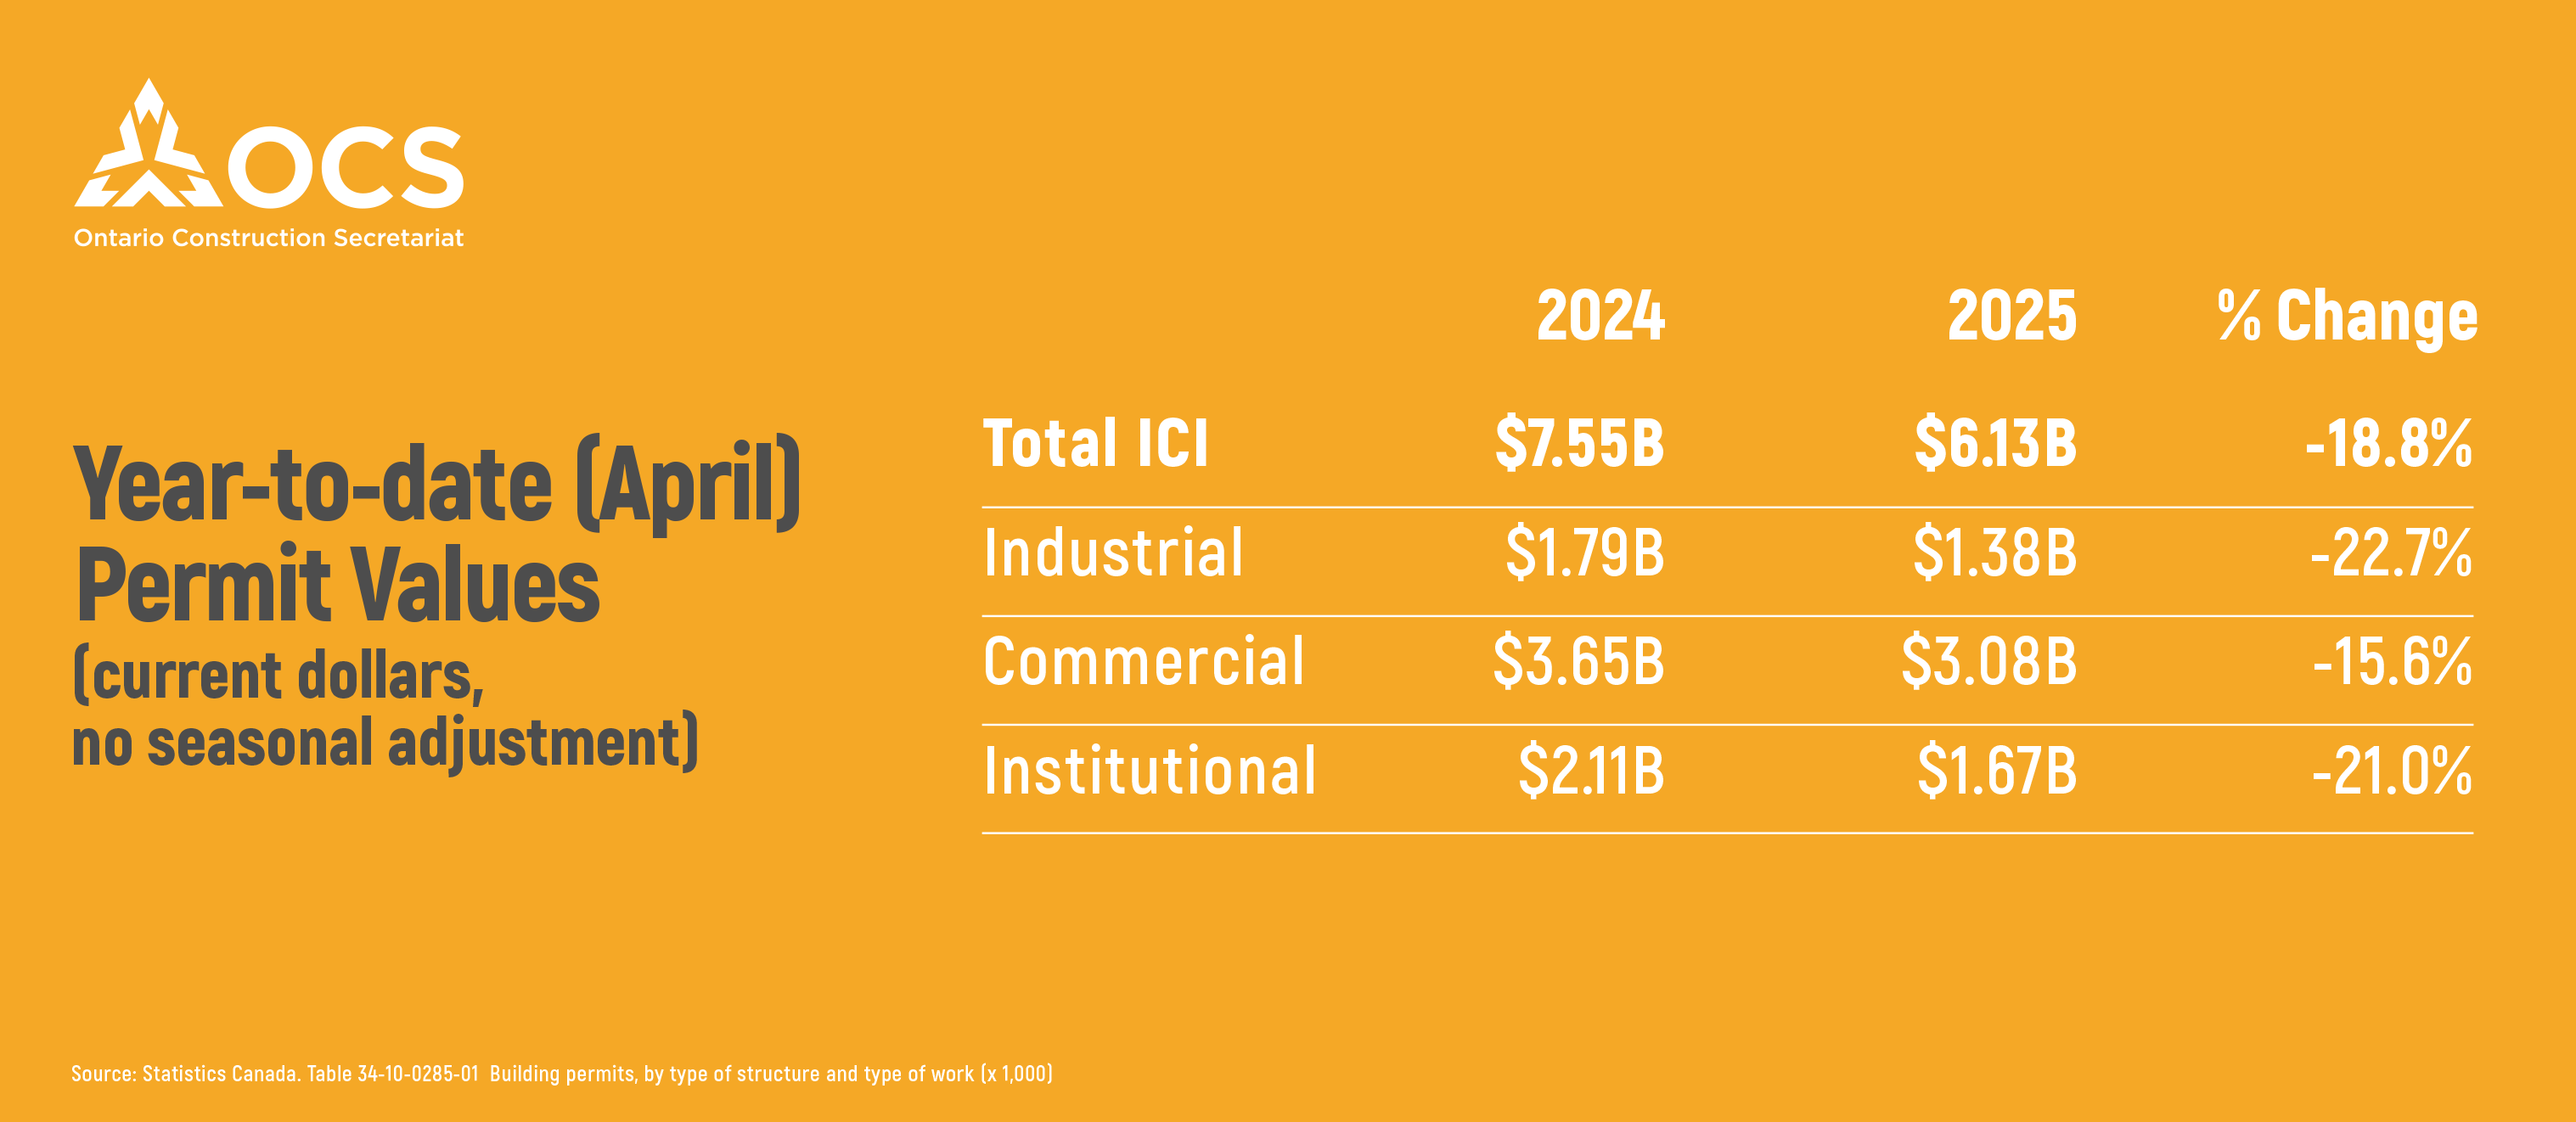
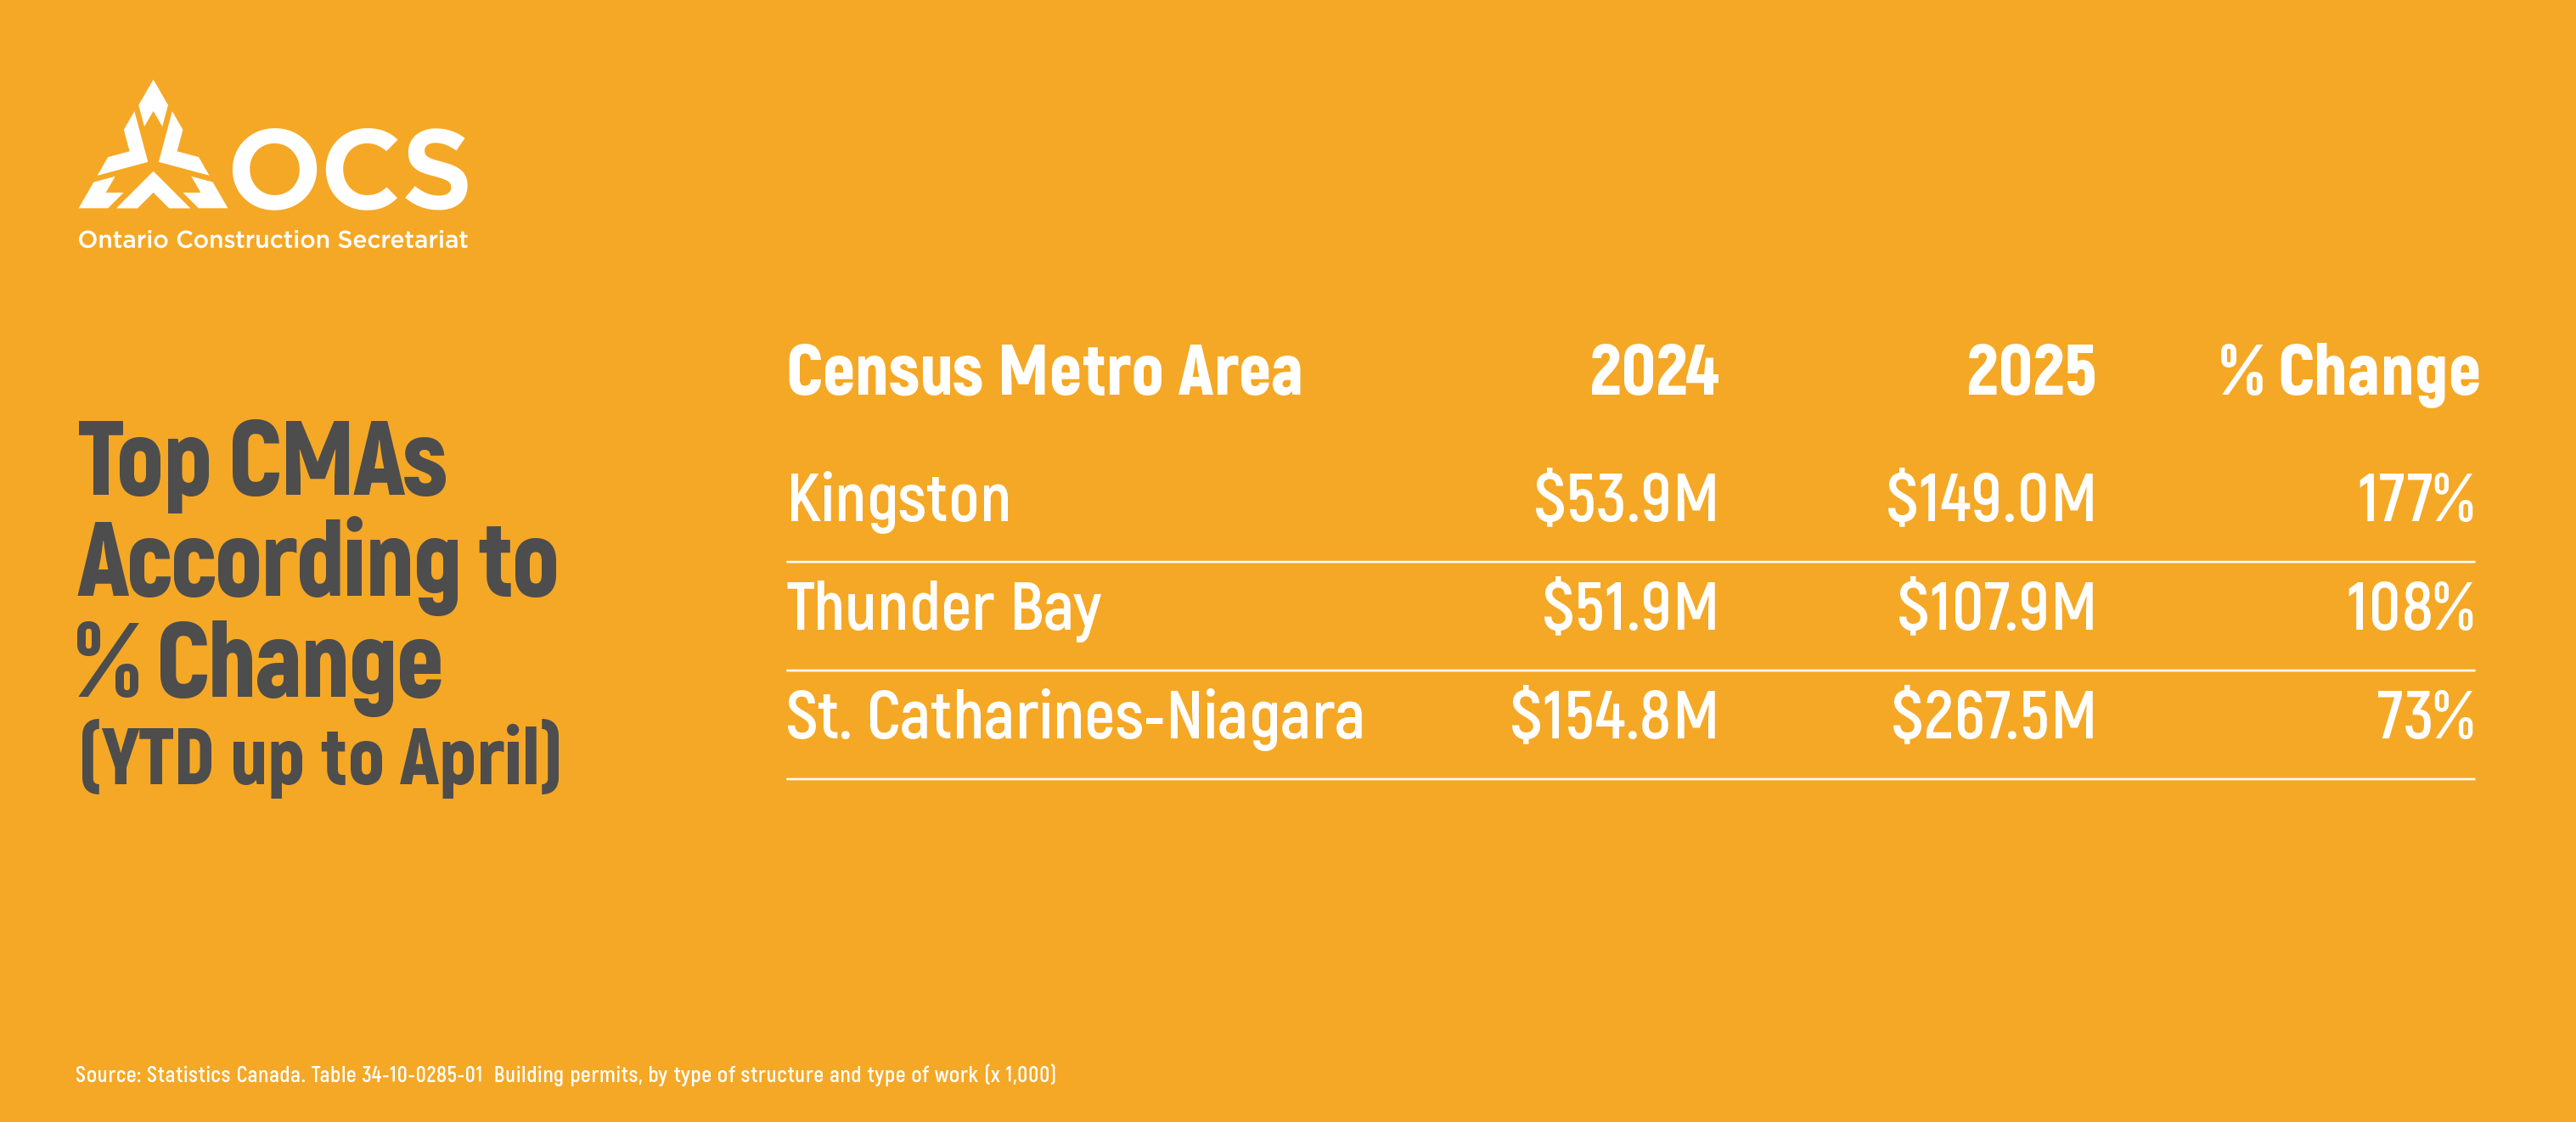
ICI permit value was up both year-over-year (y/y) and month-over-month (m/m) in April, owing to a steady commercial sector and gains in industrial permit value. While year-to-date (YTD) was down -18.8 percent, several areas showed strength. At the city level, Kingston, Thunder Bay, and St. Catharines had large YTD percentage increases. By structure type, laboratories saw a noticeable boost, while office buildings maintained a high permit value.
APRIL SEES SMALL REBOUND
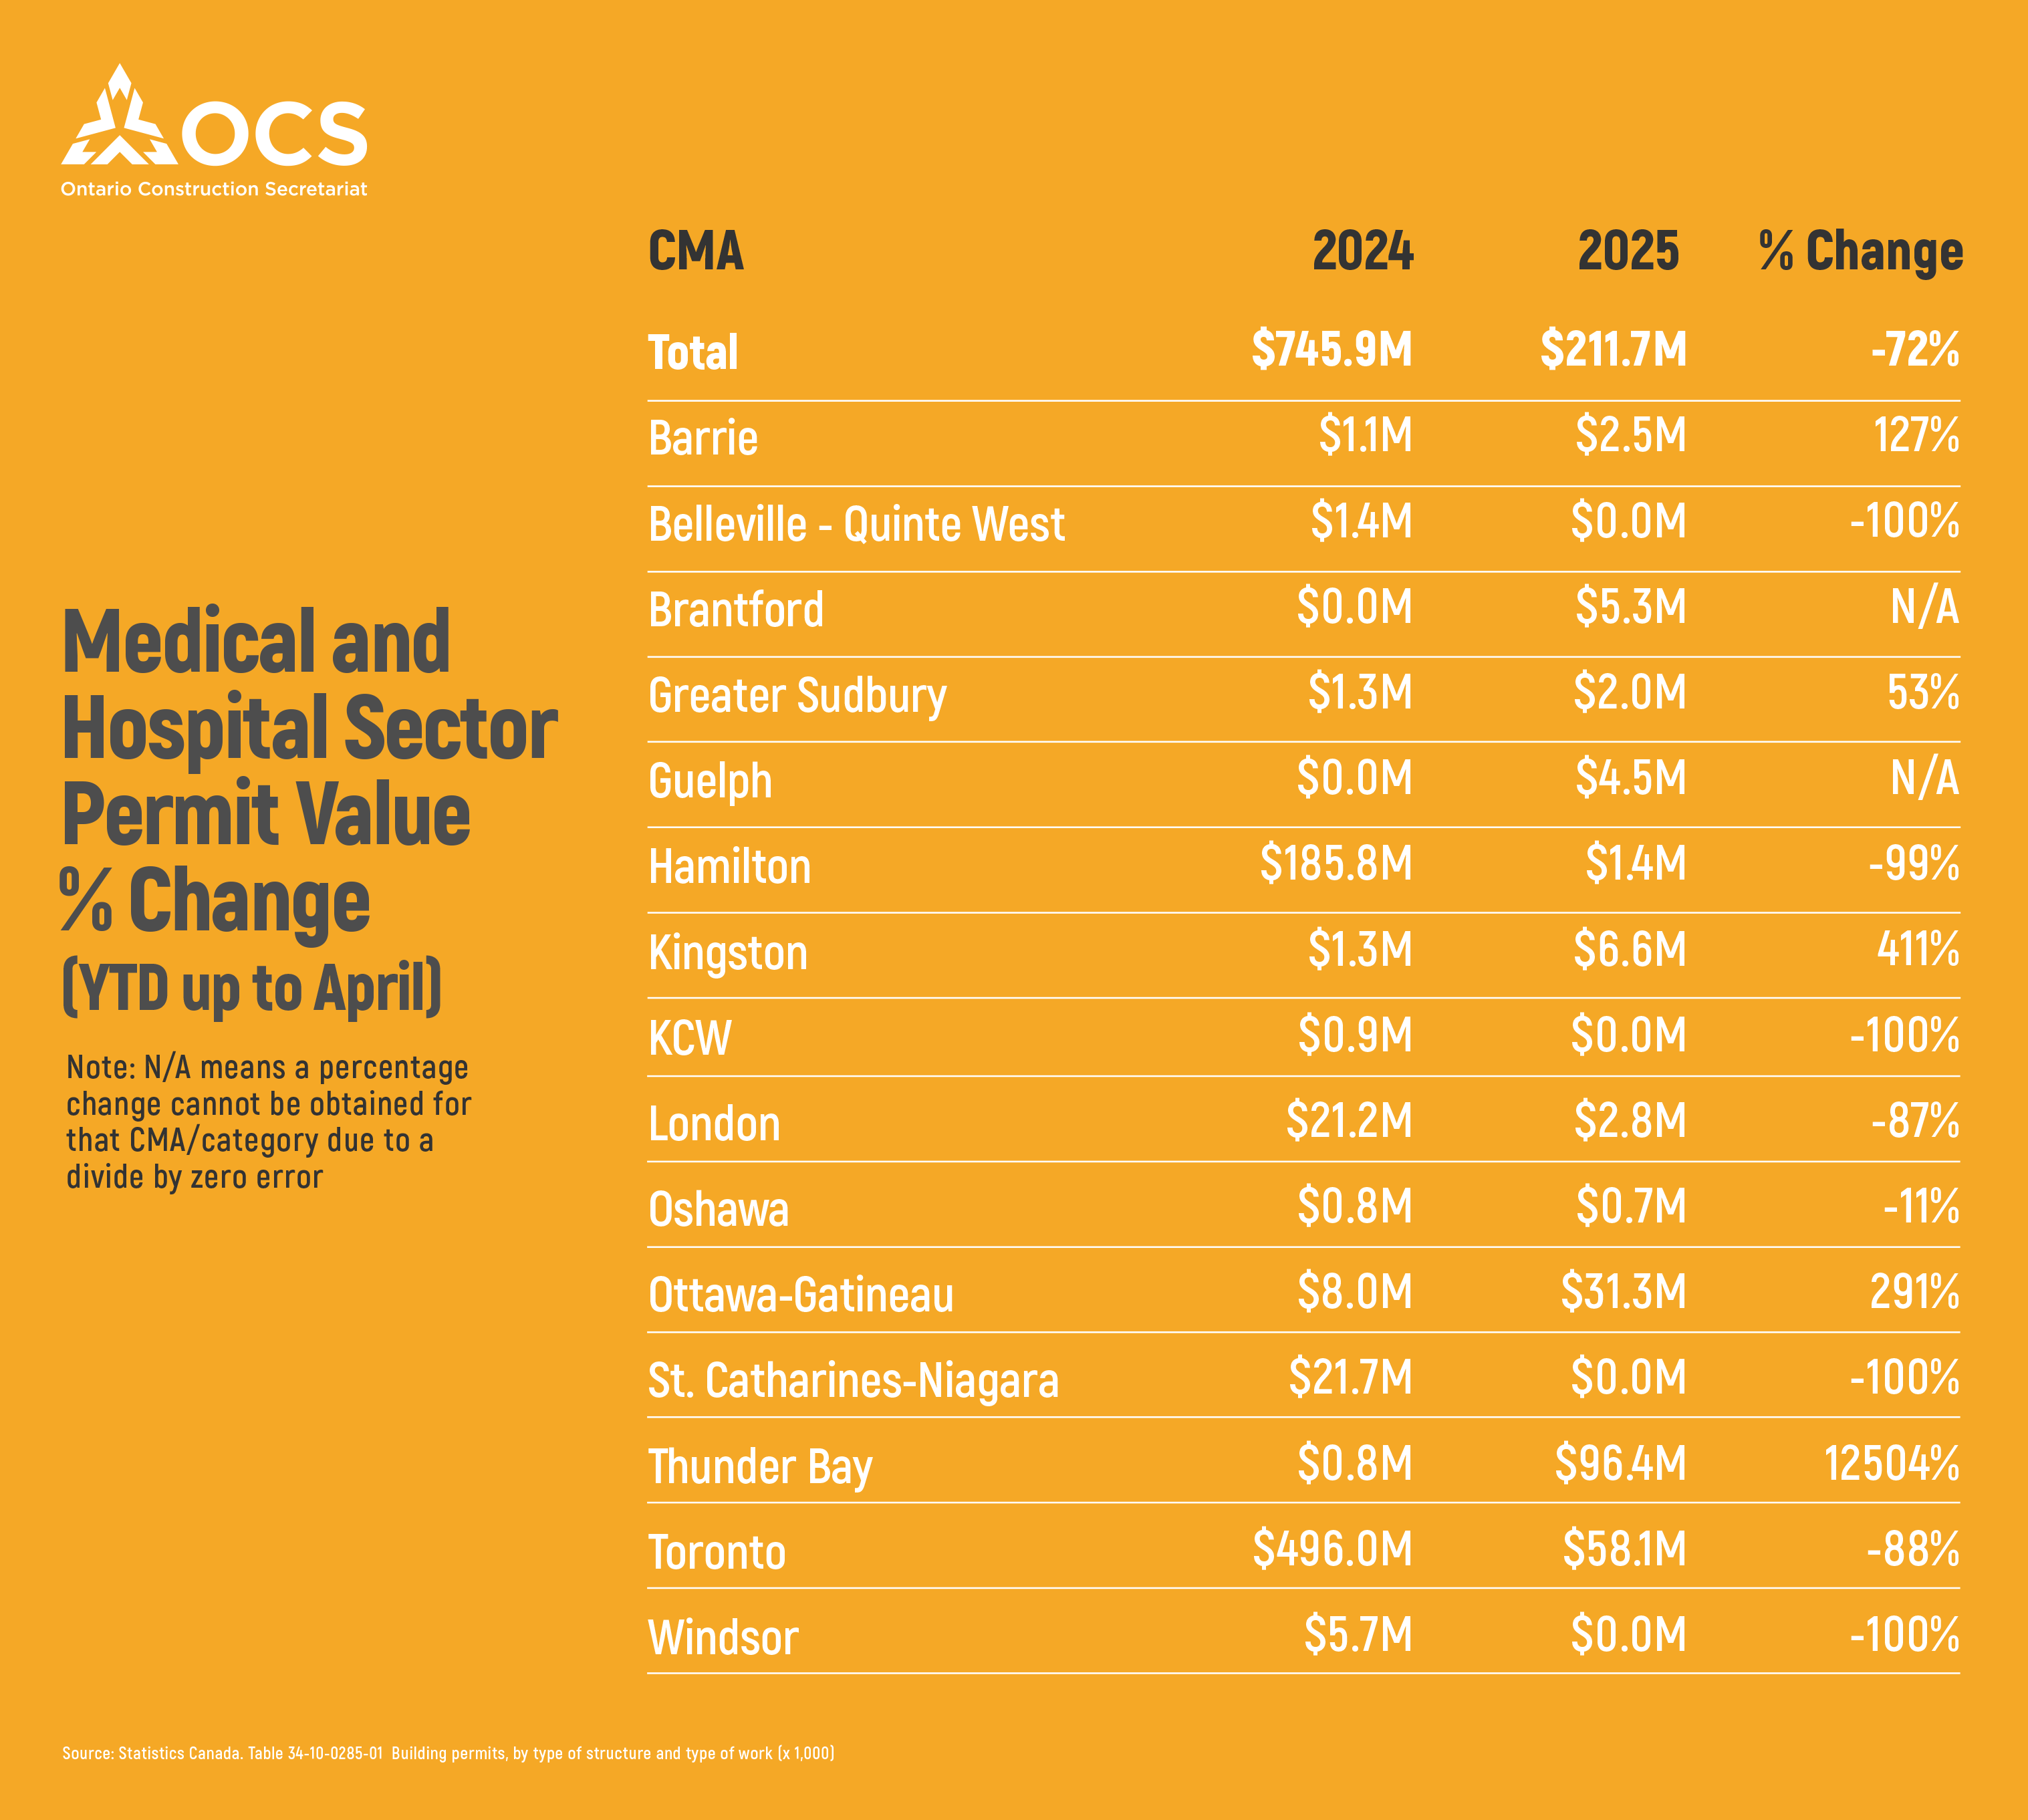
April permit value increased 5% y/y in April ($1.76B to $1.85B) and 10% m/m. The bulk of the strength came from an 8% y/y increase in the industrial sector, jumping from $844M to $910M. On the other hand, YTD permit values were much lower relative to 2024 (though still at a respectable level relative to the last 5 years). Weakness was concentrated in the institutional sector as the medical and hospital component saw a decline of -72%, with multiple regions down significantly in YTD terms (see chart below). Toronto medical and hospital permit value in particular has significantly cooled. However, it is important to note that permit value captures the entire value of the project at the time the permit was issued. Much of the hospital work is continuing, but permits for new work have not been issued.
PERMIT VALUE BY STRUCTURE
Laboratories YTD permit value jumped over tenfold from $2.1M to $27M in 2025, with permitting activity partially related to an urban farm lab in Scarborough. Looking instead at the value (rather than the percentage change), office buildingssat on top with $2.15B in YTD permit value. To nobody’s surprise, this was concentrated in Toronto, at $878M (down from the $909B at this time last year). While the office space component has seen recent weakness, April value was up 65% y/y (from $251M to $414.M).
PERMIT VALUE BY CENSUS METROPOLITAN AREA (CMA)
Kingston and Thunder Bay remained as the top growing CMAs. Kingston’s YTD permit value increase was concentrated in school and education ($4.5M to $109.4M), warehouses ($0.9M to $20.3M), and trade and services ($0.4M to $4.3M). Thunder Bay’s increase came almost entirely from medical and hospital permit value which jumped to $96.4M back in January, versus the $0.8M in January 2024 (as mentioned in a previous bulletin, this was related to a new cardiac arrest surgery unit and mental health and addictions spaces which were introduced to Thunder Bay Regional Health Science Centre). St. Catharines saw large YTD increases across various structure types, most prominently in the transportation and utilities sector, which spiked from $5.9M to $127.9M.
As a final note of interest and as noted in our last edition of Stay Connected, Hamilton reached $1B in permit value at record pace this year, with 40% of the value coming from the non-residential side. The YTD percent increases were mainly from hotels and restaurants ($7.5M to $148M) and factories and plants ($3.8M to $25.9M; $19M alone in April).
OVERALL
While year-to-date permit values ran lower compared to 2024 (most notably in medical structures), April figures picked up momentum and overall YTD remained strong from a historic perspective. Certain regions (Kingston and Thunder Bay) and building types soared above their 2024 levels, signalling multiple pockets of strength.
____________________________
FOR MORE INFORMATION, CONTACT:
Ali Ahmad
Research Analyst
Ontario Construction Secretariat (OCS)
180 Attwell Drive, Suite 360, Toronto, ON M9W 6A9
P 416.620.5210 ext. 222
aahmad@iciconstruction.com