
February 13, 2026
SUMMARY
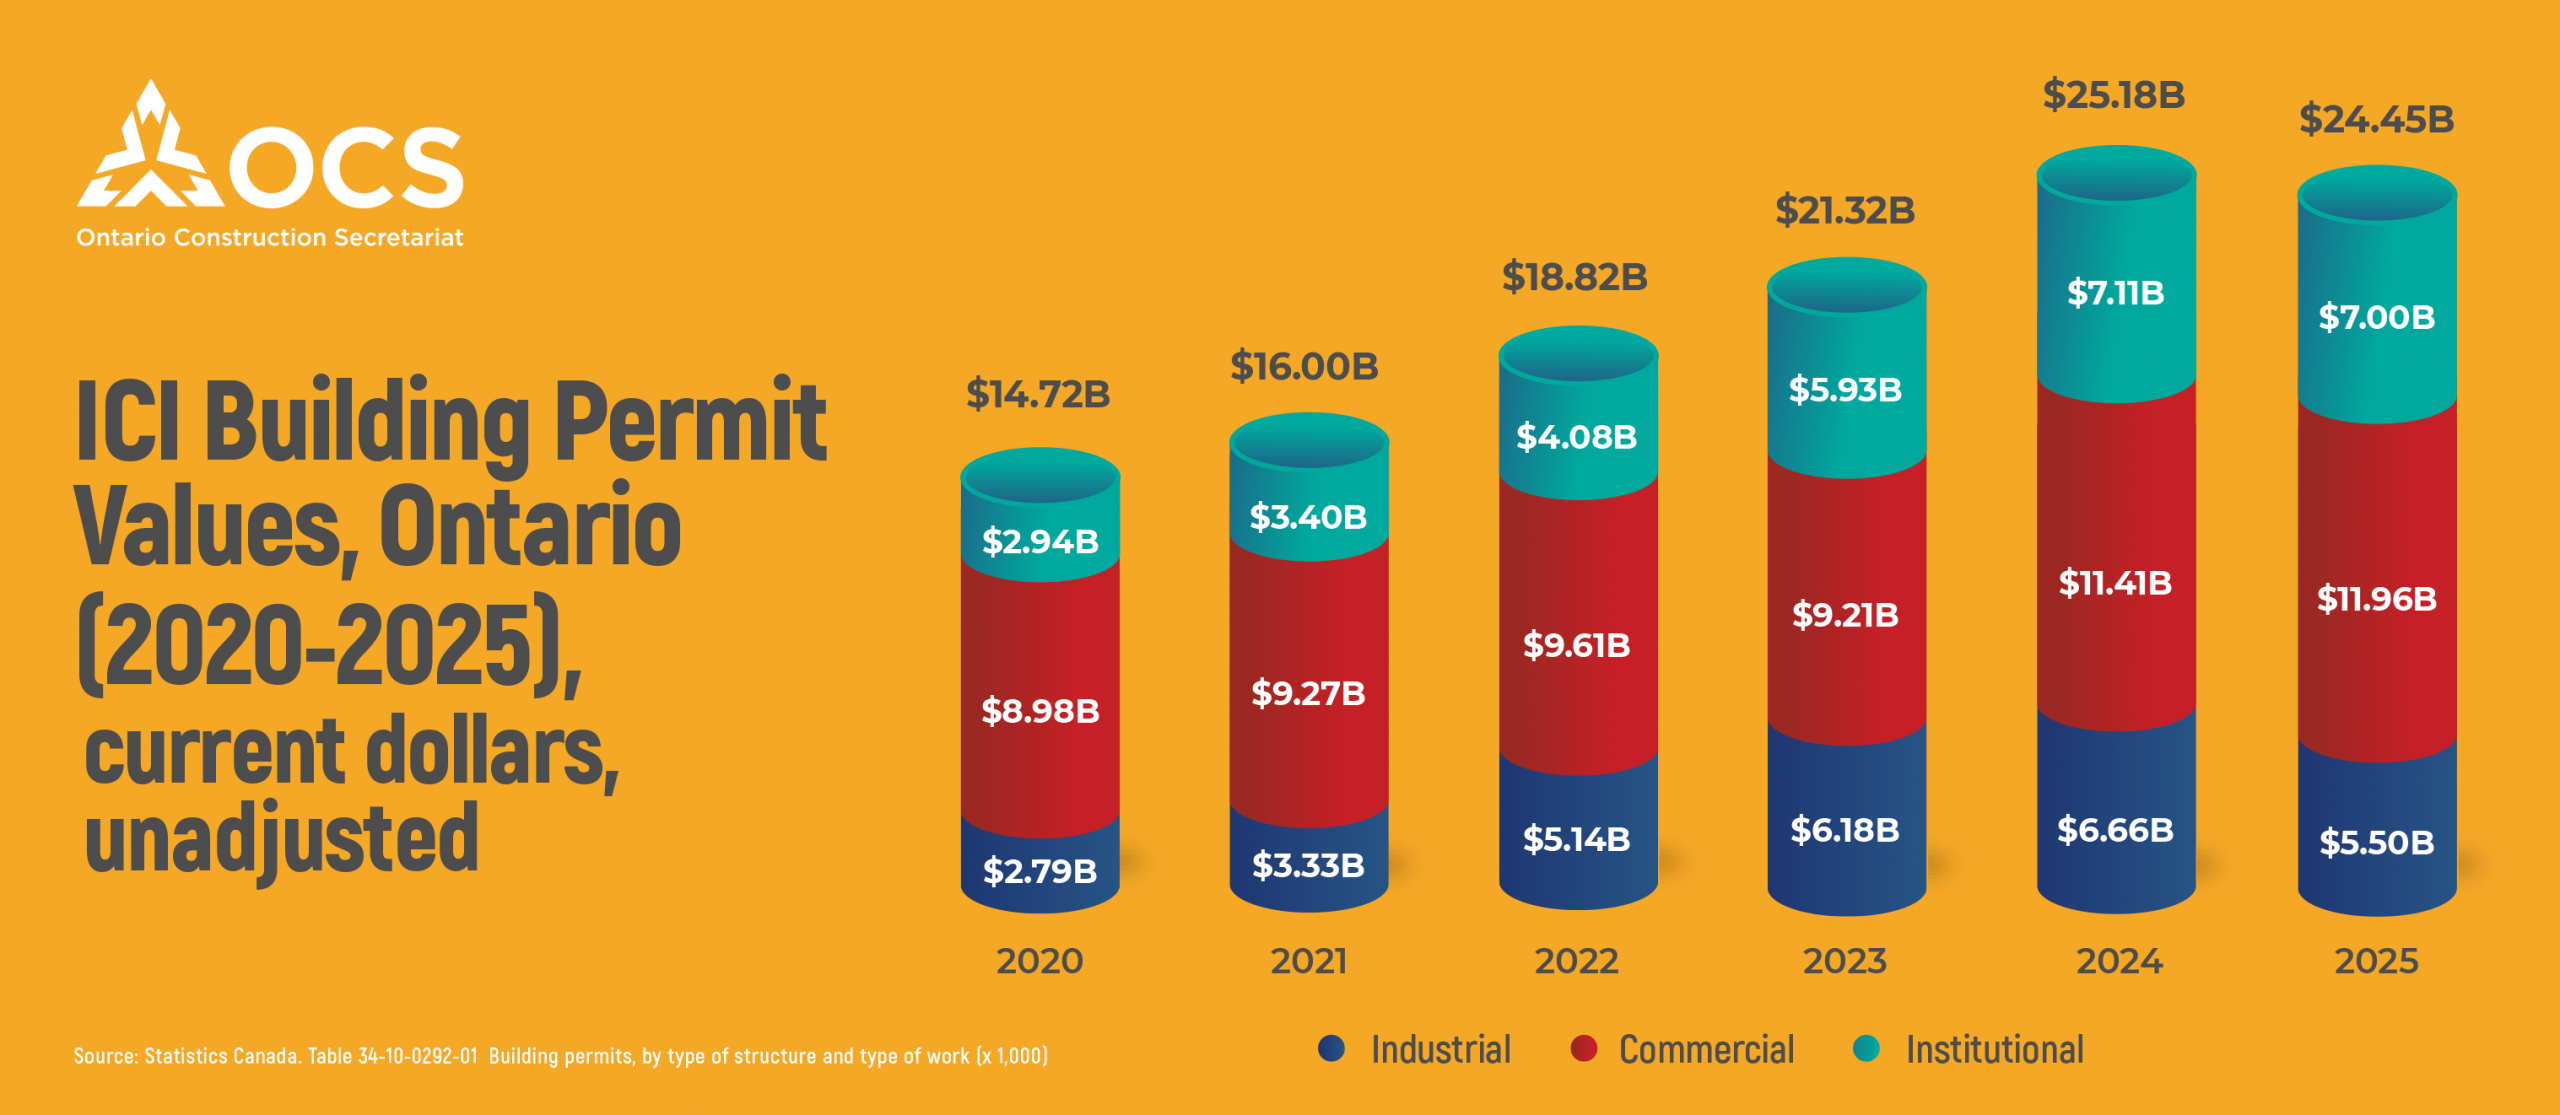
Ontario’s ICI building permit activity totaled $24.45 billion in 2025, down 2.9% from the previous year, largely due to weaker industrial construction. Commercial building was the only sub sector to record annual growth and remained the largest share of total permit activity.
Despite the annual decline, activity strengthened in the fourth quarter, suggesting improved momentum heading into the new year. Several mid-sized CMAs also posted strong gains, reflecting uneven but localized growth across the province.
OVERVIEW OF ONTARIO’S 2025 BUILDING PERMIT ACTIVITY
Total industrial, commercial and institutional building permits in Ontario reached $24.45 billion in 2025. This was 2.9% lower than in 2024, which had been the strongest year in the past five years.
The overall decline was mainly due to weaker activity in the industrial sector, where permit values fell by 17.4%. The institutional sector also declined slightly, down 1.6%. Commercial construction was the only sub-sector to post growth, increasing by 4.8% over the year.
STRONG FINISH TO THE YEAR
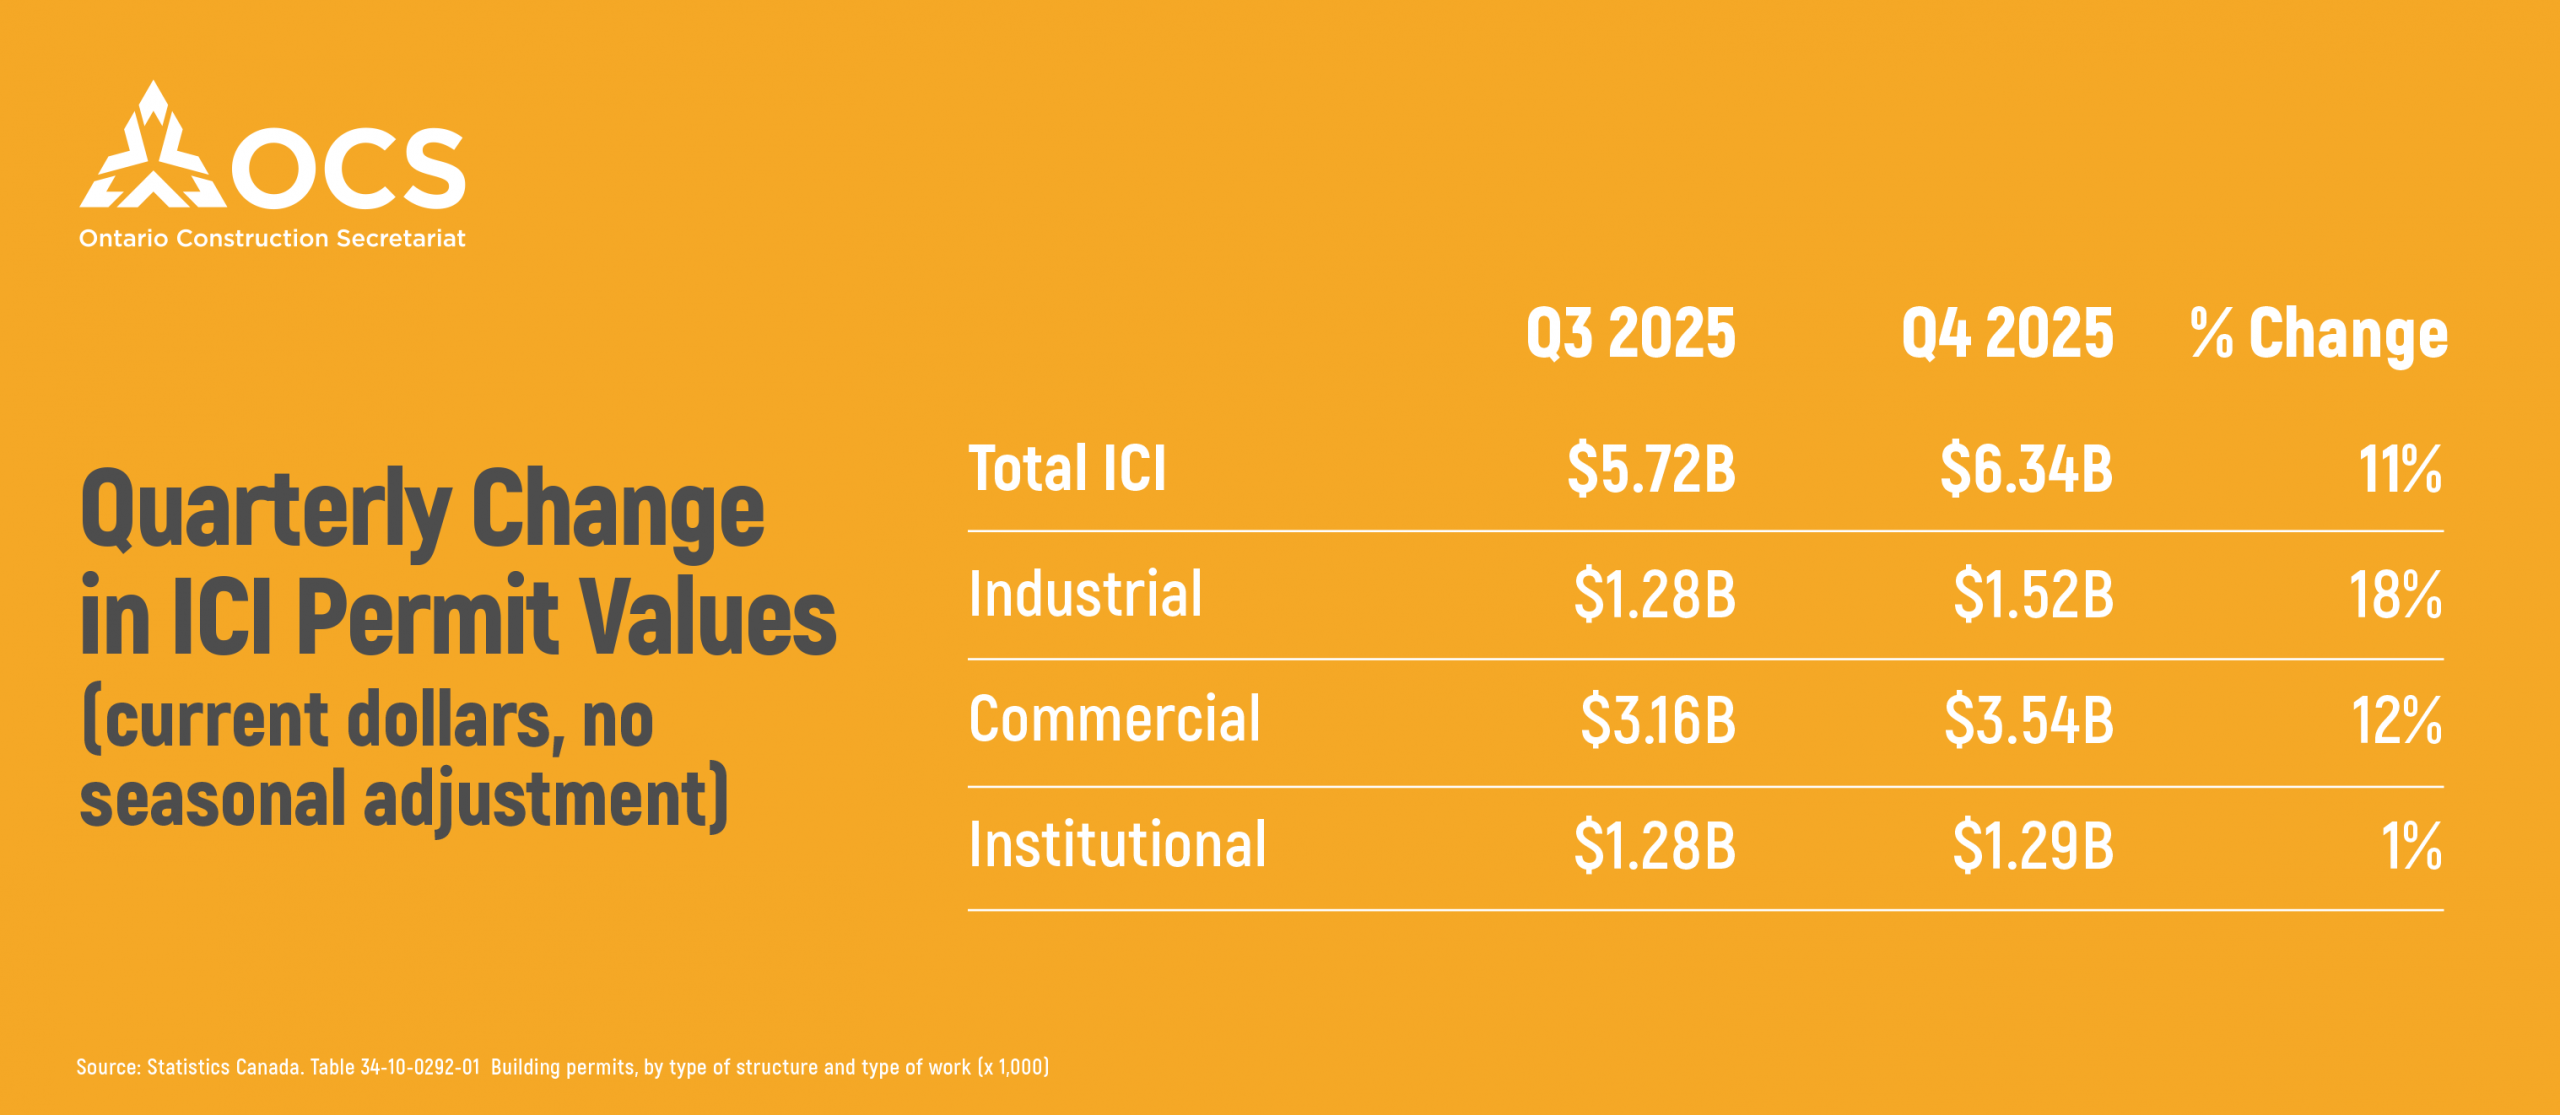
Although annual results show a decline, activity picked up toward the end of the year.
In the fourth quarter of 2025, total ICI permit values rose 11% compared with the third quarter. The industrial sector led this rebound with an 18% increase. Commercial permits grew 12%, while institutional permits remained relatively stable with a modest 1% gain.
This late year improvement suggests renewed momentum after earlier weakness.
 REGIONAL HIGHLIGHTS ACROSS ONTARIO
Toronto received $11.6 billion of building permits, a rise of 4% since 2024, mainly driven by commercial and industrial sector.
Excluding Toronto, which typically records the highest permit values, St. Catharines–Niagara reported the largest total ICI permit value in 2025 at $2.25 billion. This growth was largely driven by institutional projects. London followed as the second highest ($1.02 billion).
St. Catharines–Niagara also recorded the strongest annual growth, with total ICI permit values rising 257% compared with 2024. Thunder Bay posted a 135% increase, supported by institutional and commercial projects. Belleville–Quinte West also performed well, with total permits up 123%, mainly due to commercial construction.
Although London recorded high permit values overall, it experienced a decline compared with the previous year.
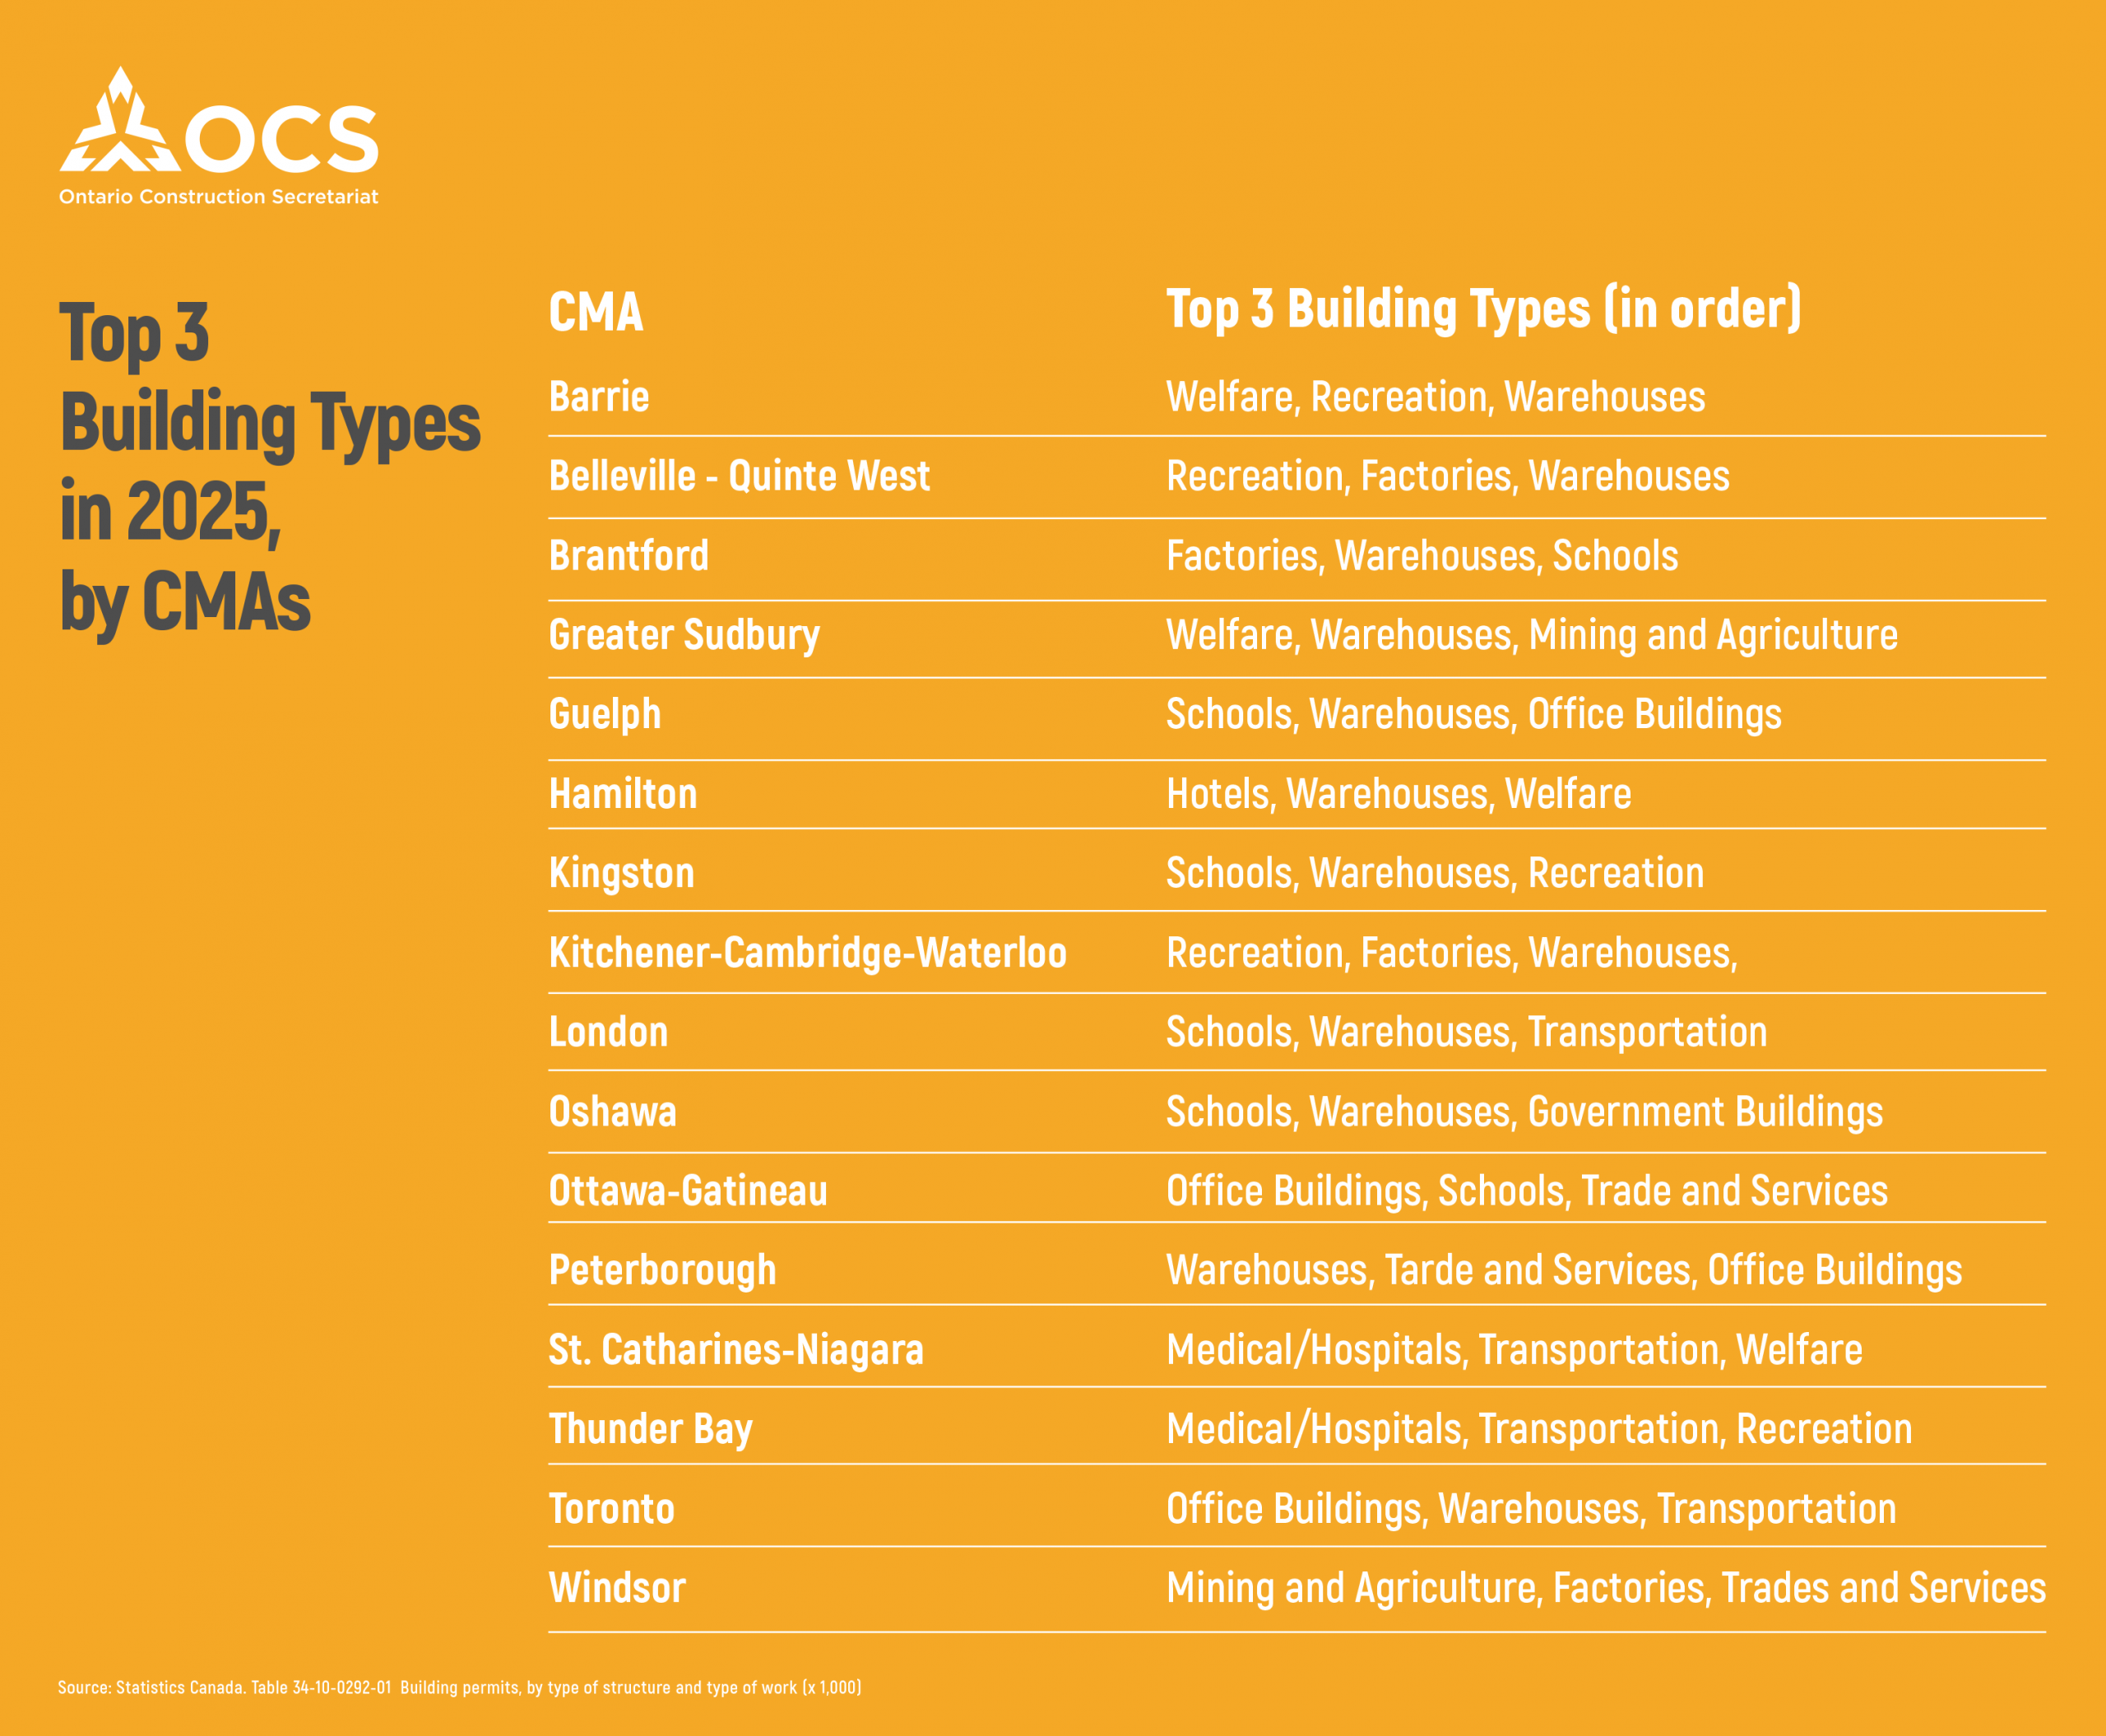
WHAT IS BEING BUILT?
Compared to last year, Factories, Government Buildings, Schools, recreation, Hotels and welfare home buildings saw a fall in building permits.
Commercial buildings accounted for nearly half (49%) of Ontario’s total ICI permit value in 2025. Within this category, office buildings (15%) and warehouses (13%) represented the largest share of activity.
Several building types saw notable increases compared with 2024, including laboratories, medical facilities and transportation related structures.
At the same time, permit values declined for factories, government buildings, schools, recreation facilities, hotels and welfare homes.
____________________________
FOR MORE INFORMATION, CONTACT:
Gargi Bharti
Economic and Research Project Lead
Ontario Construction Secretariat (OCS)
180 Attwell Drive, Suite 360, Toronto, ON M9W 6A9
P 416.620.5210
gbharti@iciconstruction.com