
January 27, 2026
SUMMARY
Ontario’s ICI construction market remained stable in November 2025, with non-residential investment holding steady despite a sharp decline in industrial construction. Commercial construction continues to lead growth, driven by office buildings and rising investment in laboratory facilities. Year-to-date results show strong regional performance, particularly in Kingston, while commercial, institutional, and industrial drivers varied across major CMAs.
ONTARIO’S ICI CONSTRUCTION INVESTMENT OVERVIEW
Ontario’s total building construction investment reached $10.1 billion in November 2025. Residential construction accounted for $7.12 billion, while non-residential investment totaled $3.0 billion.
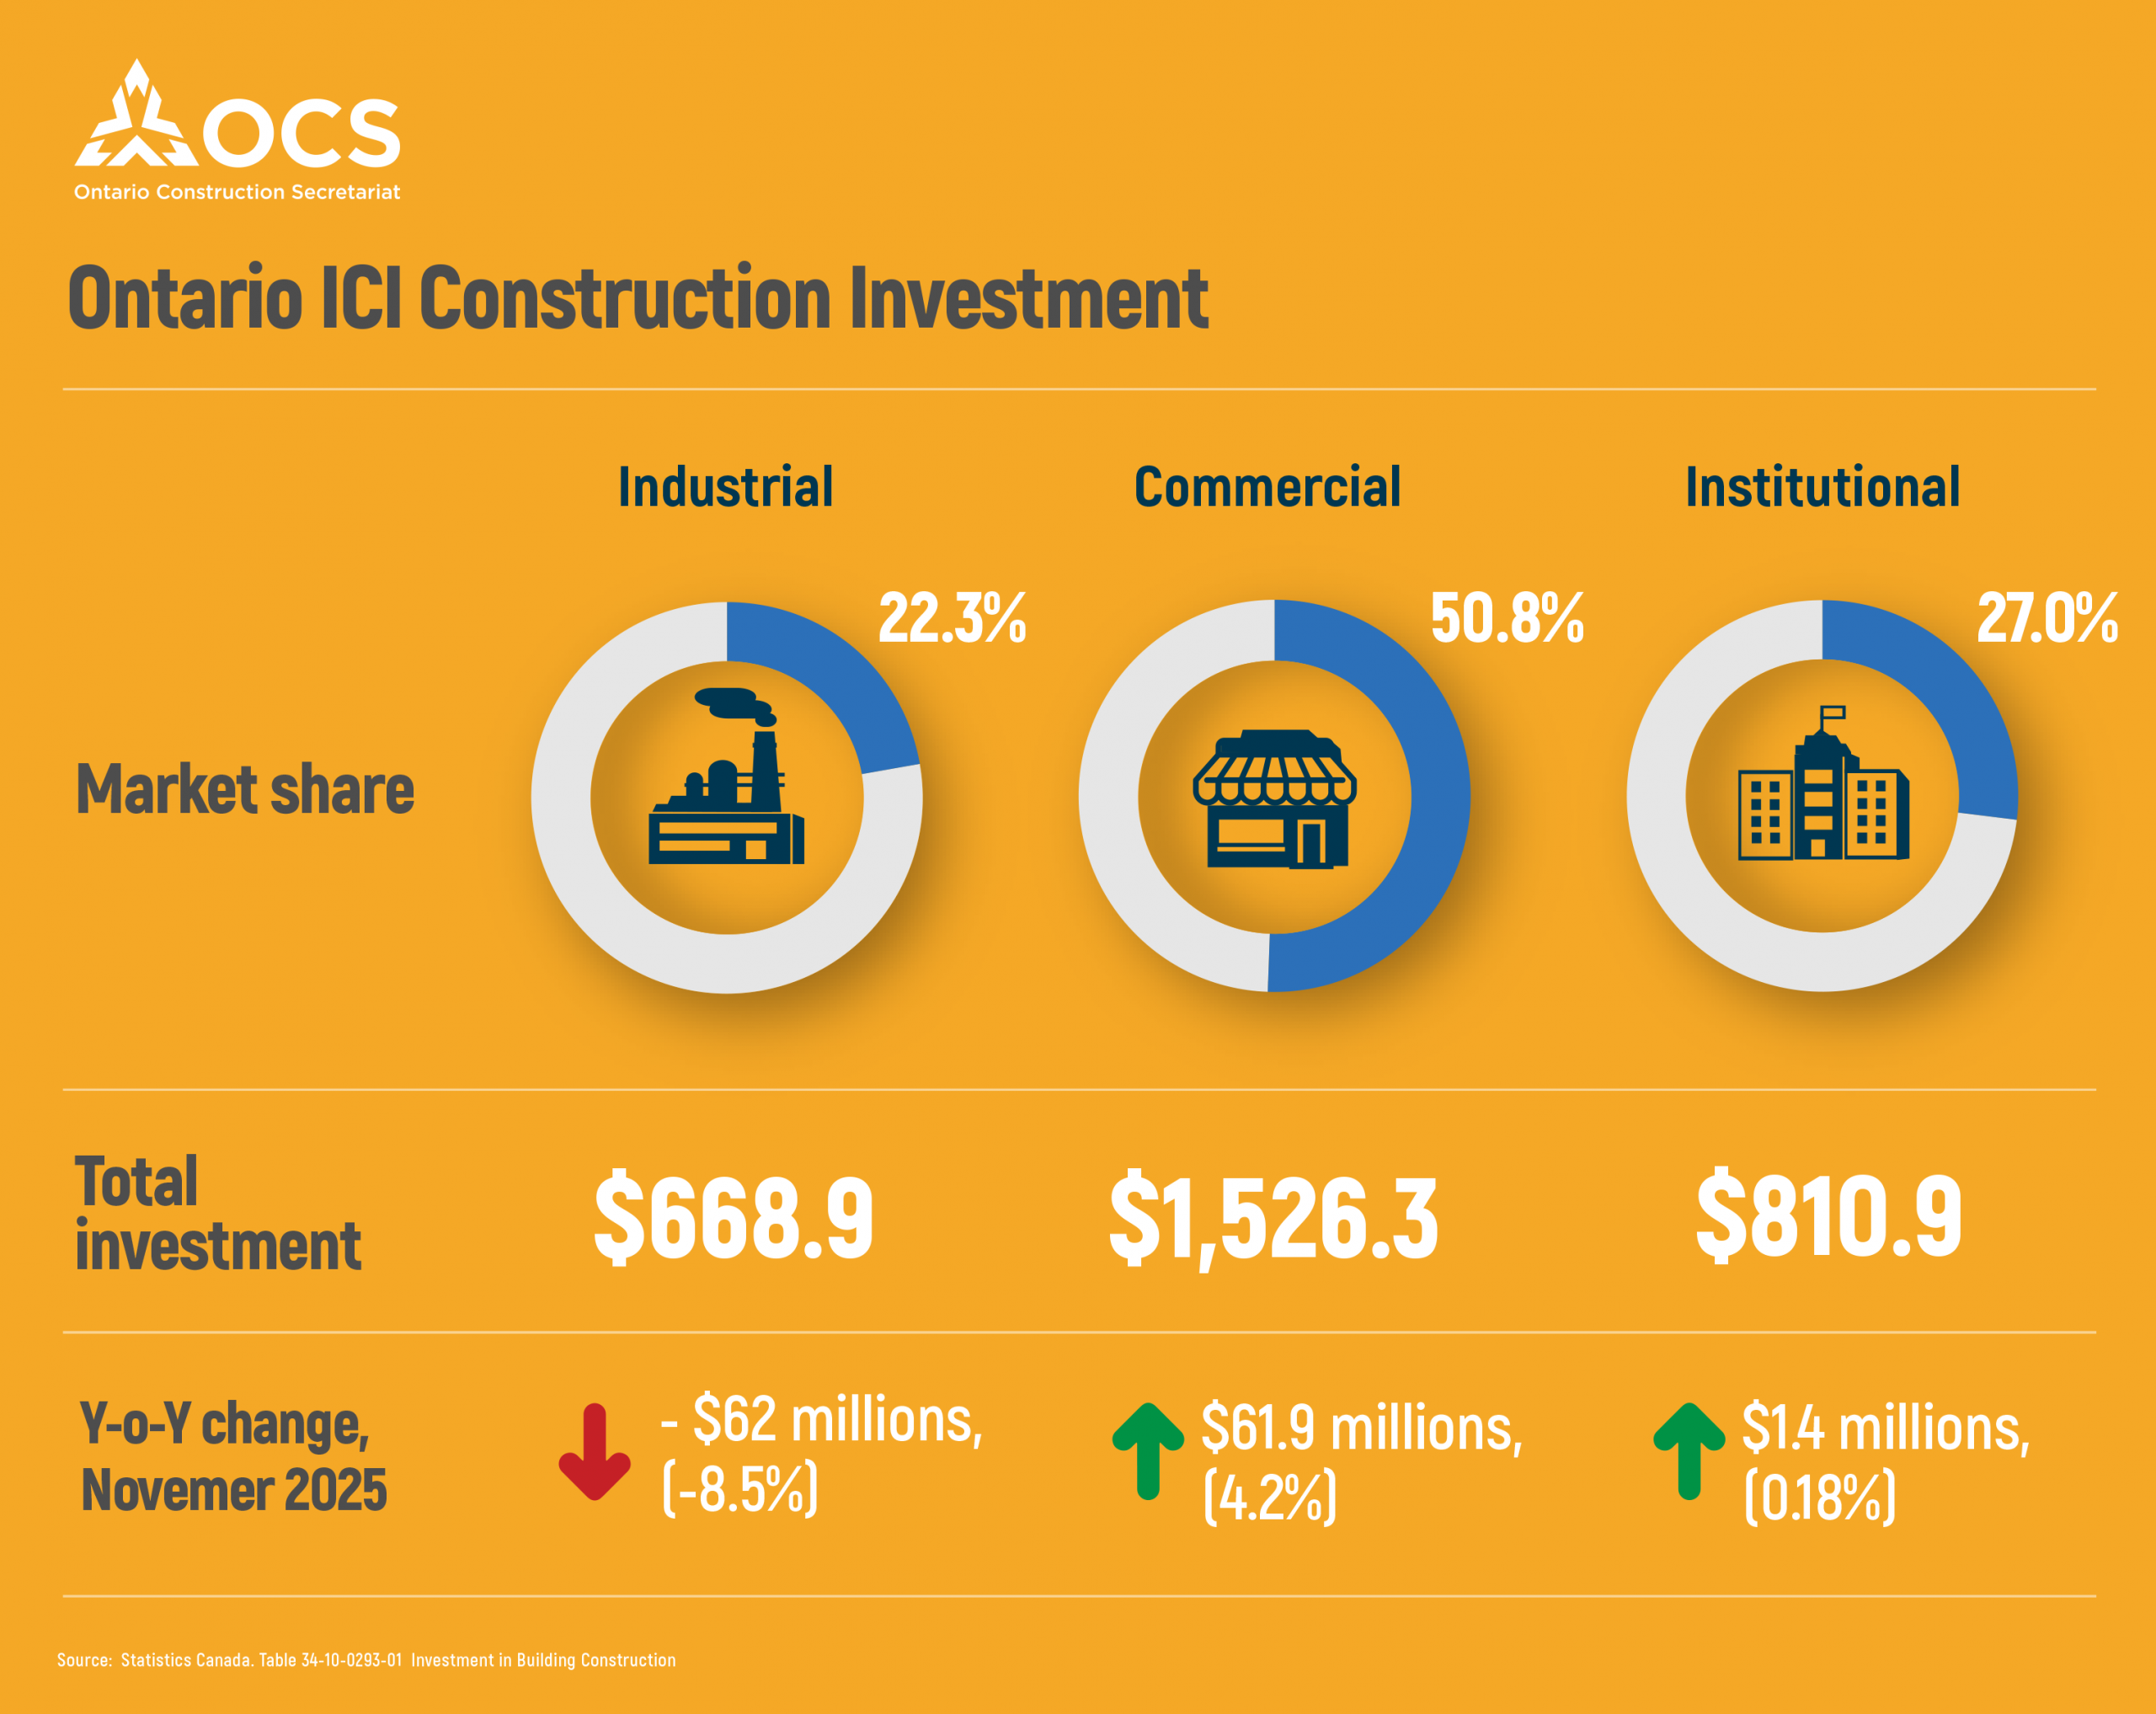
Non-residential investment remained mostly flat, rising just 0.05% year over year. This stability reflects mixed performance across its components. Industrial construction declined by 8.48%, while institutional construction edged up by only 0.18%. In contrast, commercial construction showed solid growth, increasing 3.9% month over month and 4.23% year over year. Overall, commercial construction continues to be the primary driver of Ontario’s ICI market.
COMMERCIAL SECTOR PERFORMANCE
Growth in Ontario’s commercial construction sector was led by office buildings, which recorded an increase of $76.5 million compared to November 2024. This was the largest dollar increase among all structure types. Toronto attracted the highest level of office investment, while Belleville posted the strongest year-over-year growth at 234%. The increase in office construction likely reflects renewed demand for office space as return-to-office policies continue to expand across industries.
Laboratory construction also showed strong momentum, with investment rising 81% year over year across Ontario. Growth was concentrated primarily in Guelph and Toronto. The weakest-performing structure types across the province were churches, factories, government buildings, and hospitals.
ICI INVESTMENT YEAR TO DATE (JANUARY TO NOVEMBER 2025)
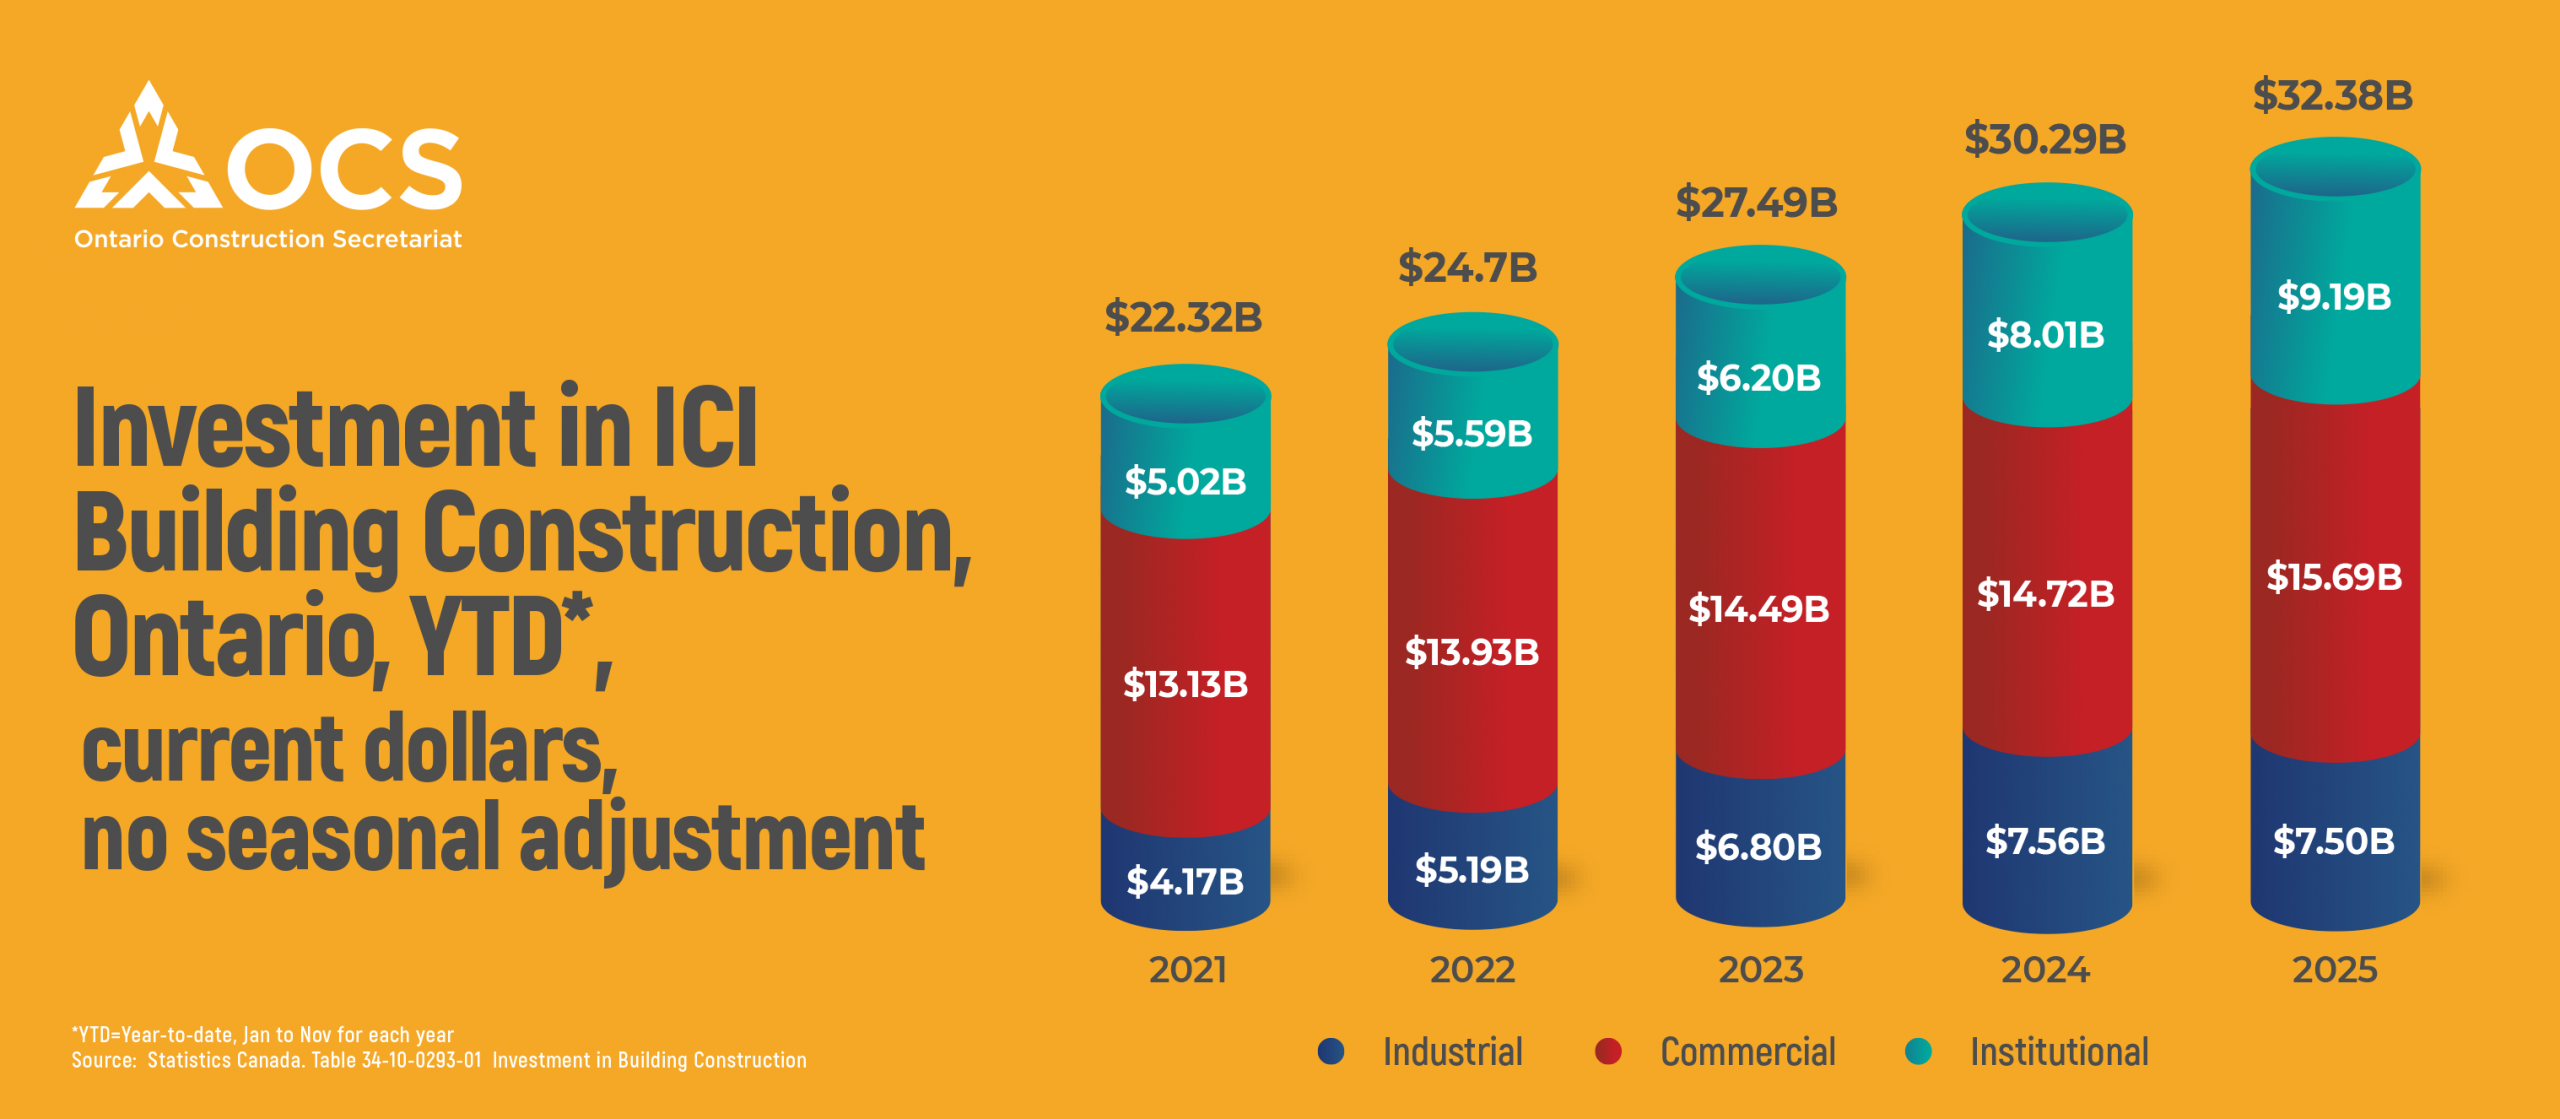
Shifting from monthly results to yearly performance, year-to-date ICI investment in Ontario stood at $32.38B, representing an increase of 6.9% compared to the same period last year. Growth was concentrated in the commercial sector, with office buildings and transportation infrastructure leading overall gains.
INVESTMENT TRENDS BY CENSUS METROPOLITAN AREA
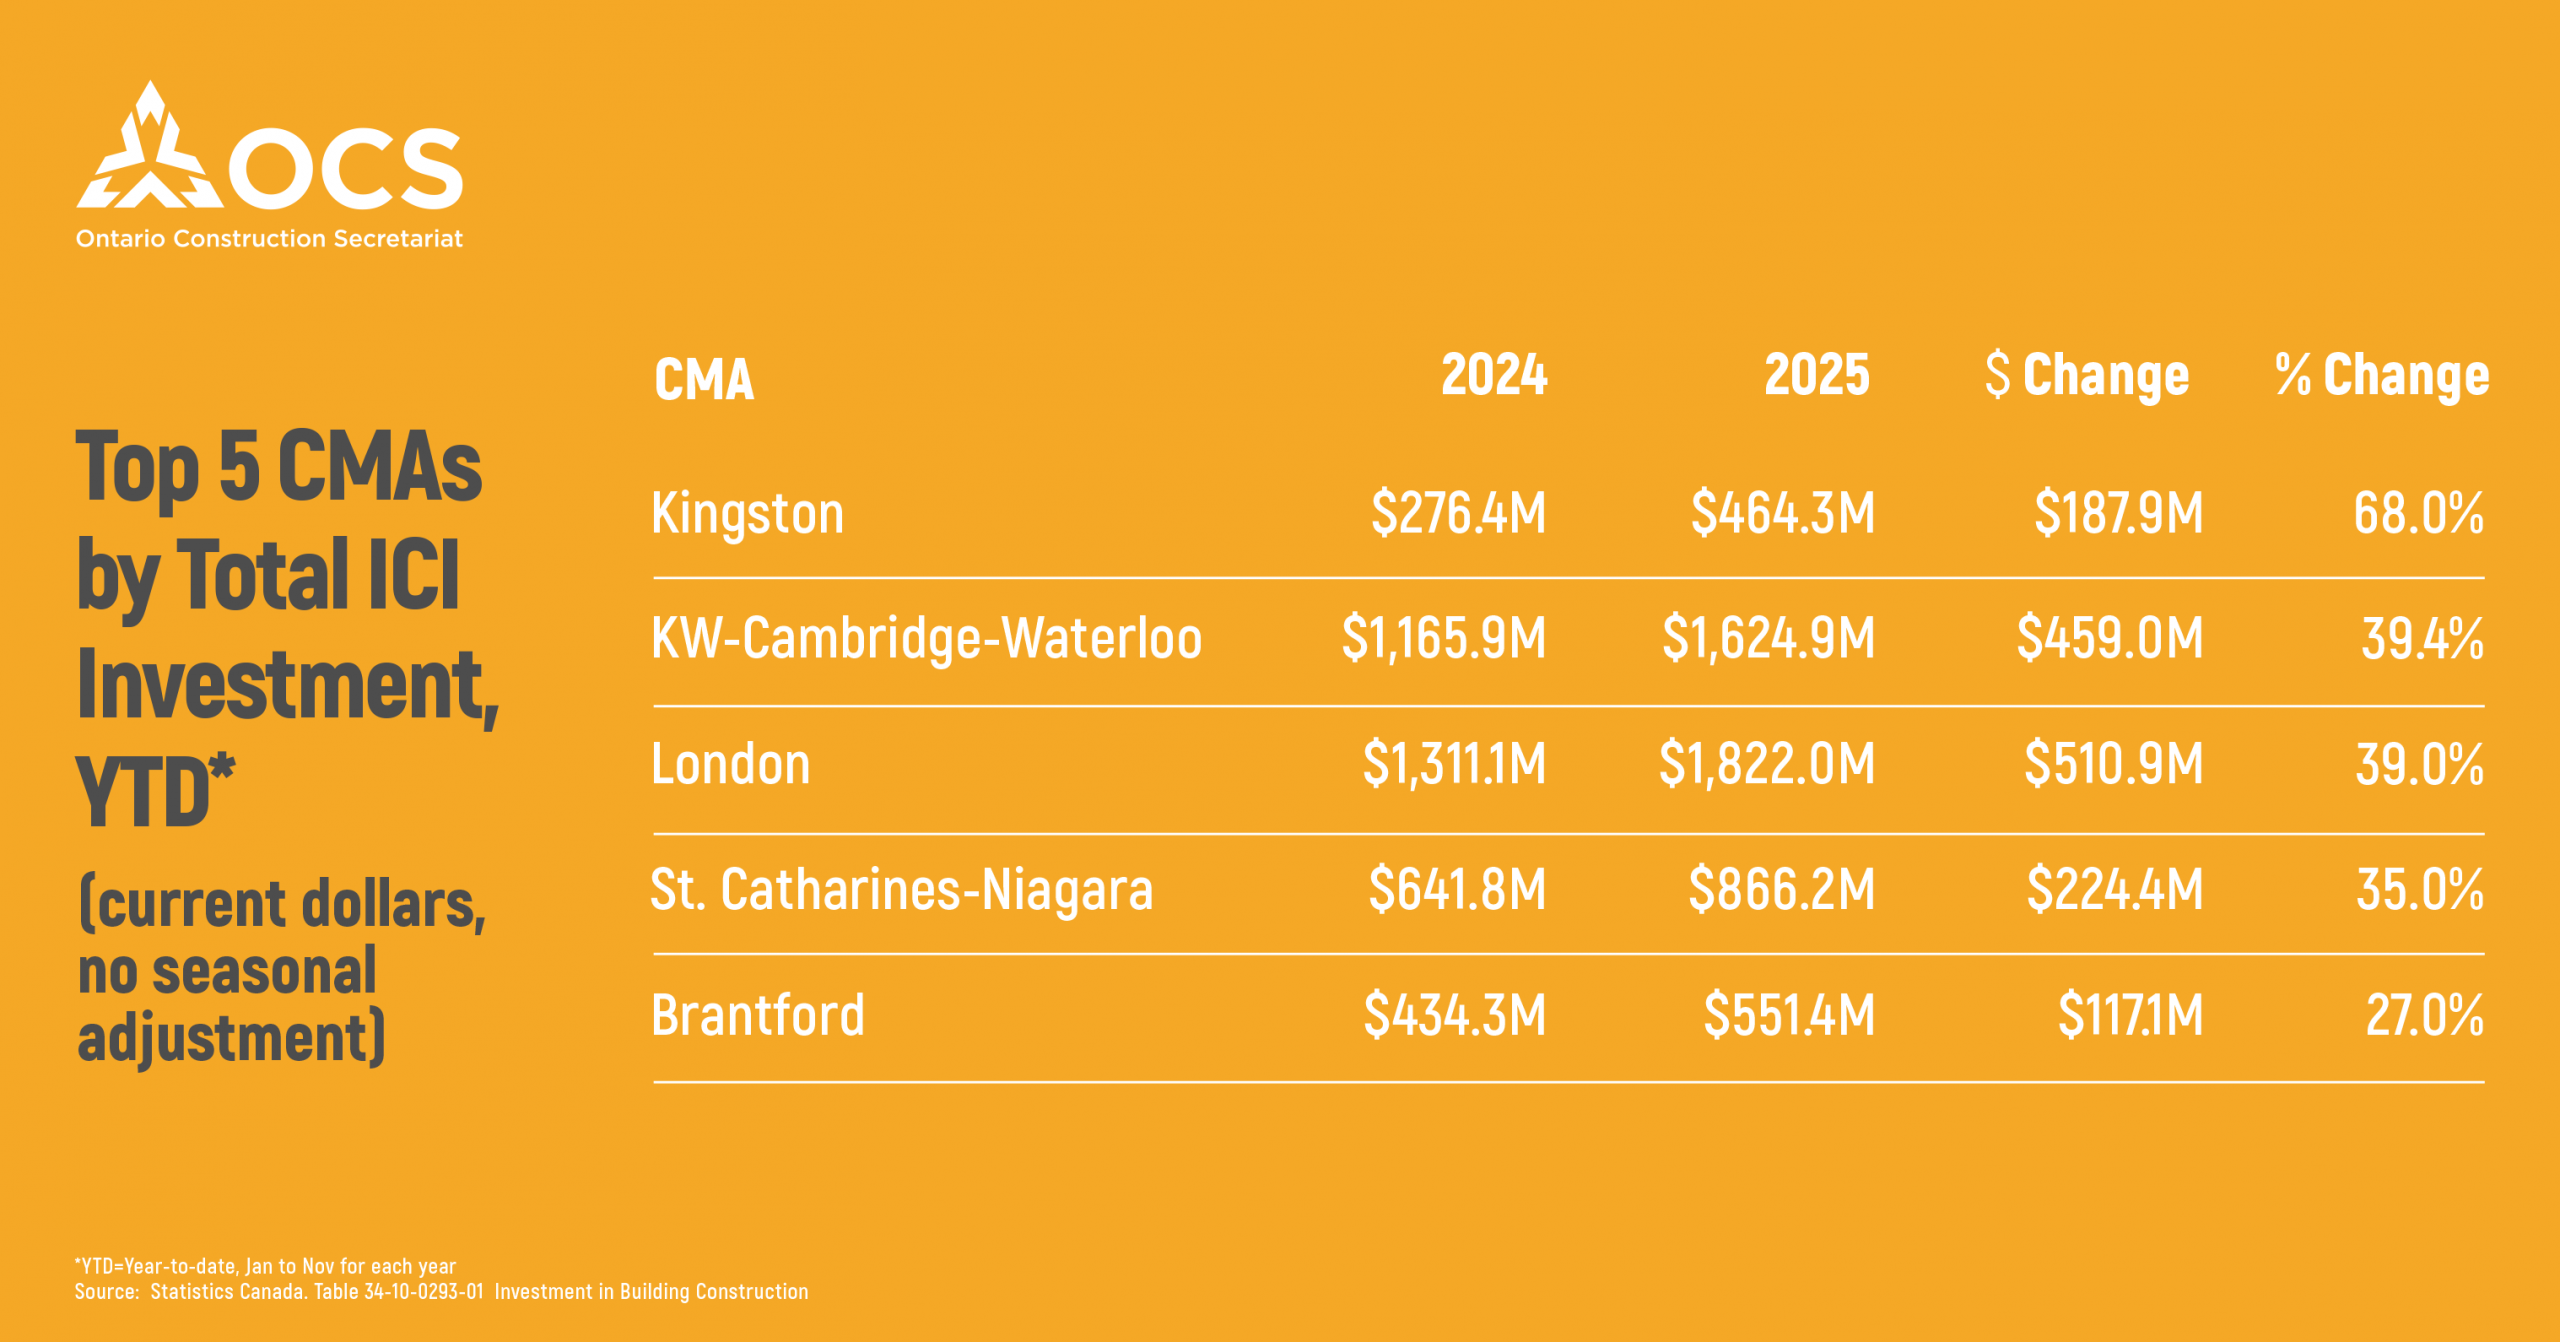
Total ICI investment across Ontario’s Census Metropolitan Areas increased by 7.7% year to date. Kingston was the standout performer in 2025, recording a 68% increase in total ICI investment compared to last year. Growth in Kingston was driven mainly by transportation projects, followed by schools and warehouses.
Kingston was followed by Kitchener-Cambridge-Waterloo and London, each posting growth of approximately 39%, while St. Catharines-Niagara saw a 35% increase. Brantford also performed well, with total investment rising 27% year to date, supported largely by institutional construction, particularly schools and education-related projects.
While institutional construction led growth in Kingston, Kitchener, and Brantford, commercial construction was the main driver in St. Catharines. In London, growth was led primarily by the industrial sector.
 ____________________________
FOR MORE INFORMATION, CONTACT:
Gargi Bharti
Economic and Research Project Lead
Ontario Construction Secretariat (OCS)
180 Attwell Drive, Suite 360, Toronto, ON M9W 6A9
P 416.620.5210
gbharti@iciconstruction.com