
April 29, 2026
SUMMARY
Total ICI construction investment in Ontario was slightly lower in February 2026 compared to both last year and last month. The commercial sector was the only area to grow year over year, supported by strong office and warehouse activity, while industrial and institutional investment declined. Growth was uneven across regions, with some smaller cities seeing strong gains and others facing sharp drops.
ONTARIO ICI CONSTRUCTION INVESTMENT
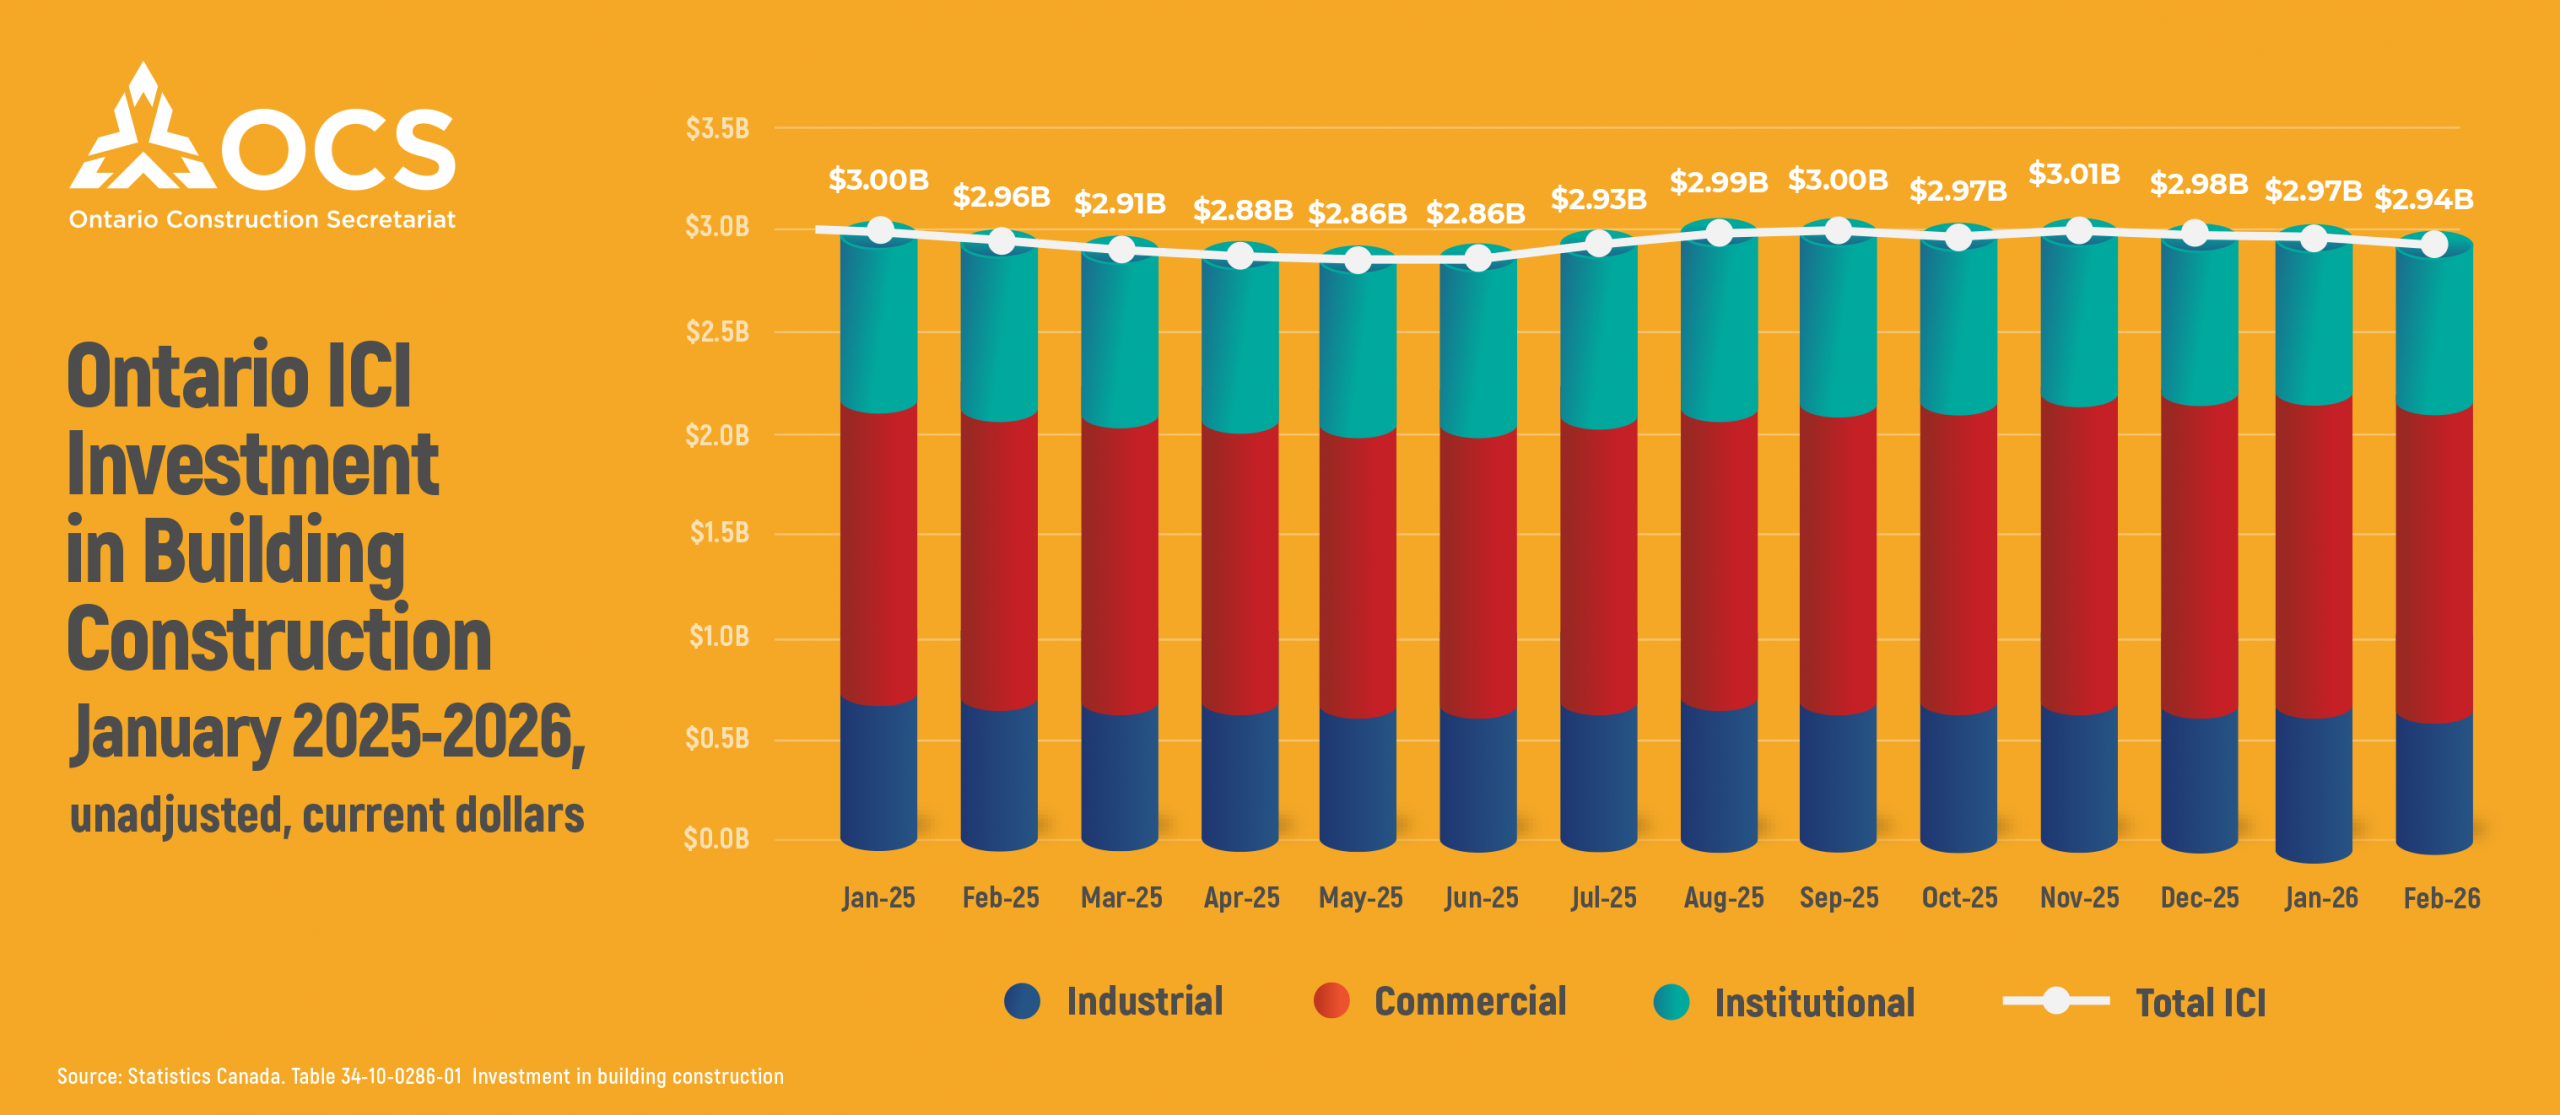
Total investment in industrial, commercial, and institutional construction reached $2.94 billion in February 2026. This is down 0.7% from February 2025 and down 1.1% from January 2026.
The commercial sector made up the largest share at 51.5%, with $1.51 billion. Institutional accounted for 26.5% with $0.78 billion, and industrial made up 22% with $0.65 billion.
All three sectors saw small declines compared to January. However, commercial investment increased by 5.9% compared to last year, making it the only sector with yearly growth.
Institutional investment dropped by 5.9% year over year, while industrial fell by 7.9%.
PERFORMANCE BY TYPE OF BUILDINGS
Office buildings have led investment since November 2025 and are getting closer to levels last seen in November 2020. They had the highest spending again in February 2026, followed by warehouses and schools.
Office projects reached $528.7 million, or 14% of total ICI spending. This is up 15.8% from last year, the largest increase among building types. About 76% of this spending was in Toronto, similar to January.
Warehouse investment rose 14.3% year over year to $287.7 million.
Laboratories are still a small category but growing quickly. Investment increased by 168.4% compared to last year, reaching $10.6 million.
In the industrial sector, transportation projects performed well. Investment increased by 26.7% and had one of the largest gains in dollar terms. On the other hand, factory investment fell by 24.8%, the biggest drop among building types.
In the institutional sector, schools received the most funding but still declined by 12.1%. Welfare homes had the strongest growth, increasing by 9.8%.
The weakest areas overall were factories, government buildings, schools, mining, and churches.
INVESTMENT TRENDS BY CENSUS METROPOLITAN AREA (CMA)
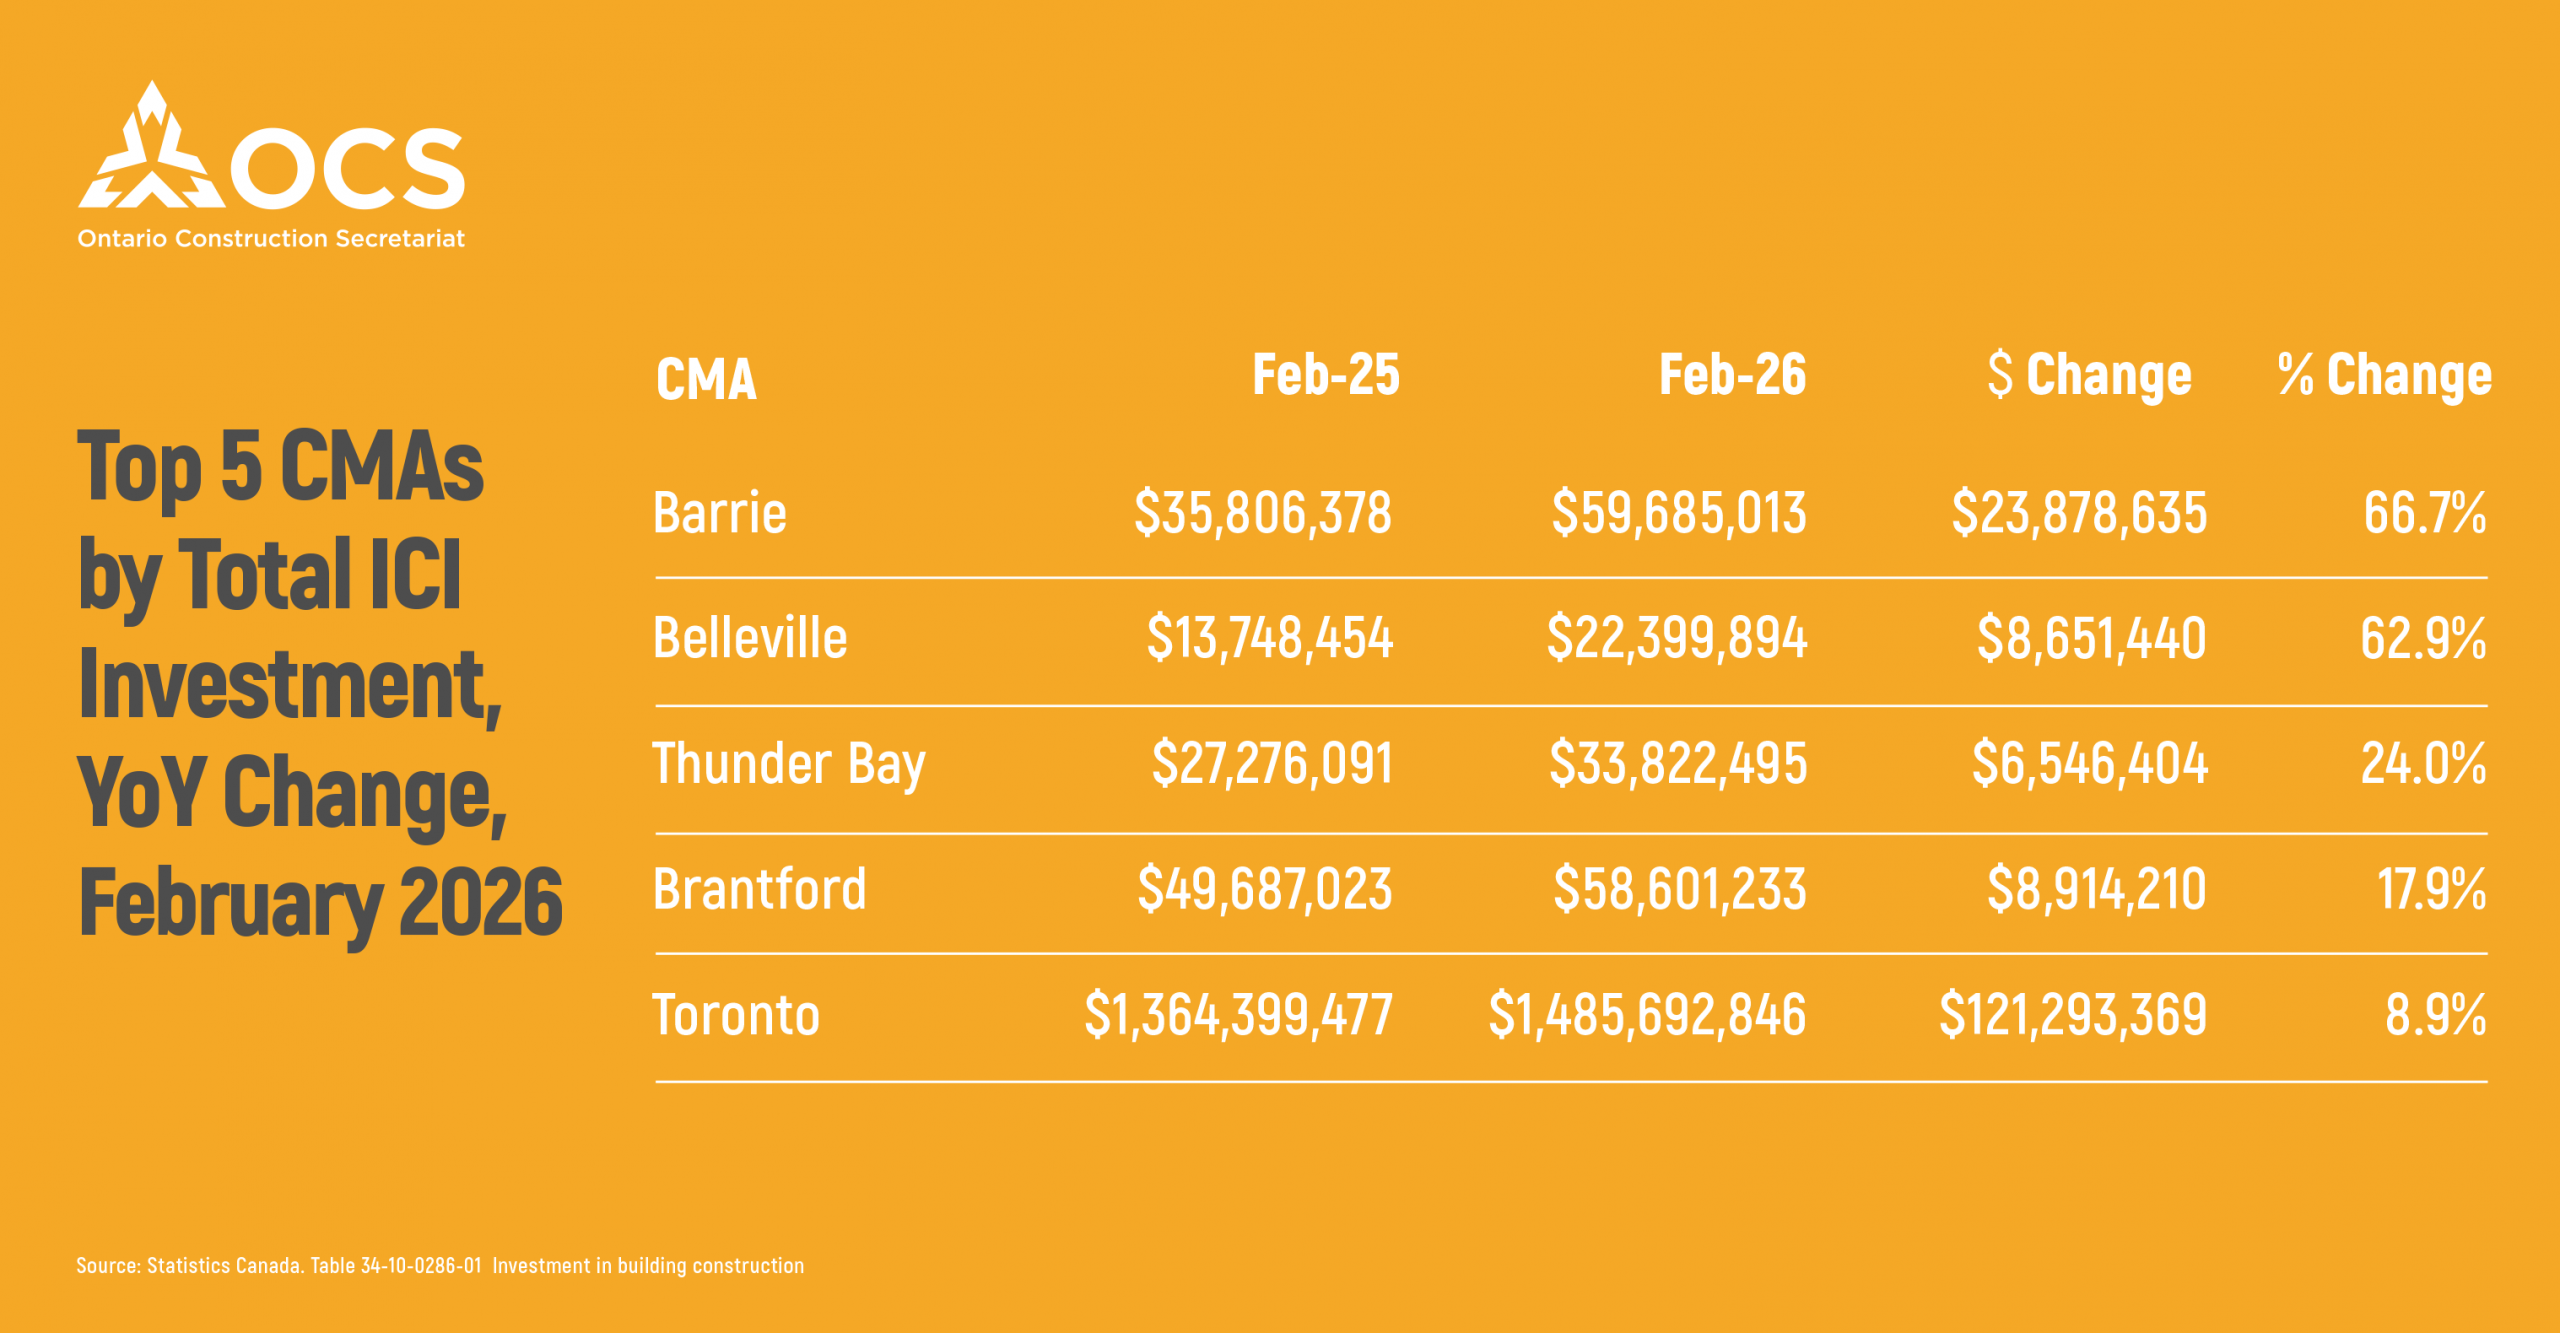
Barrie had the strongest growth in February 2026, with investment up 66.7% compared to last year. This was driven by commercial and industrial projects, especially welfare, recreation, and office buildings.
Belleville and Thunder Bay also saw strong growth, increasing by 62.9% and 24.0%. Brantford rose by 17.9%, and Toronto increased by 8.9%.
Belleville saw gains in both commercial and industrial construction. Thunder Bay and Brantford were supported by industrial projects, with Brantford also seeing strong institutional growth. In Toronto, growth came from commercial and industrial activity.
Peterborough and Windsor had the weakest results. Investment fell by 49.2% in Peterborough and 32.5% in Windsor.
____________________________
FOR MORE INFORMATION, CONTACT:
Gargi Bharti
Economic and Research Project Lead
Ontario Construction Secretariat (OCS)
180 Attwell Drive, Suite 360, Toronto, ON M9W 6A9
P 416.620.5210
gbharti@iciconstruction.com