


September 18, 2026
SUMMARY
Ontario’s industrial, commercial and institutional (ICI) building permit value fell to $2.17 billion in July, down 68.8% from the record level seen in June. Much of the decline reflected a return to more typical levels following a major medical permit that pushed institutional activity sharply higher in June.
Commercial construction accounted for just over half of July’s ICI permit value. Regionally, Toronto remained the largest market, while Brantford recorded a sharp increase in activity and had the highest permit value outside Toronto.
PROVINCIAL OVERVIEW
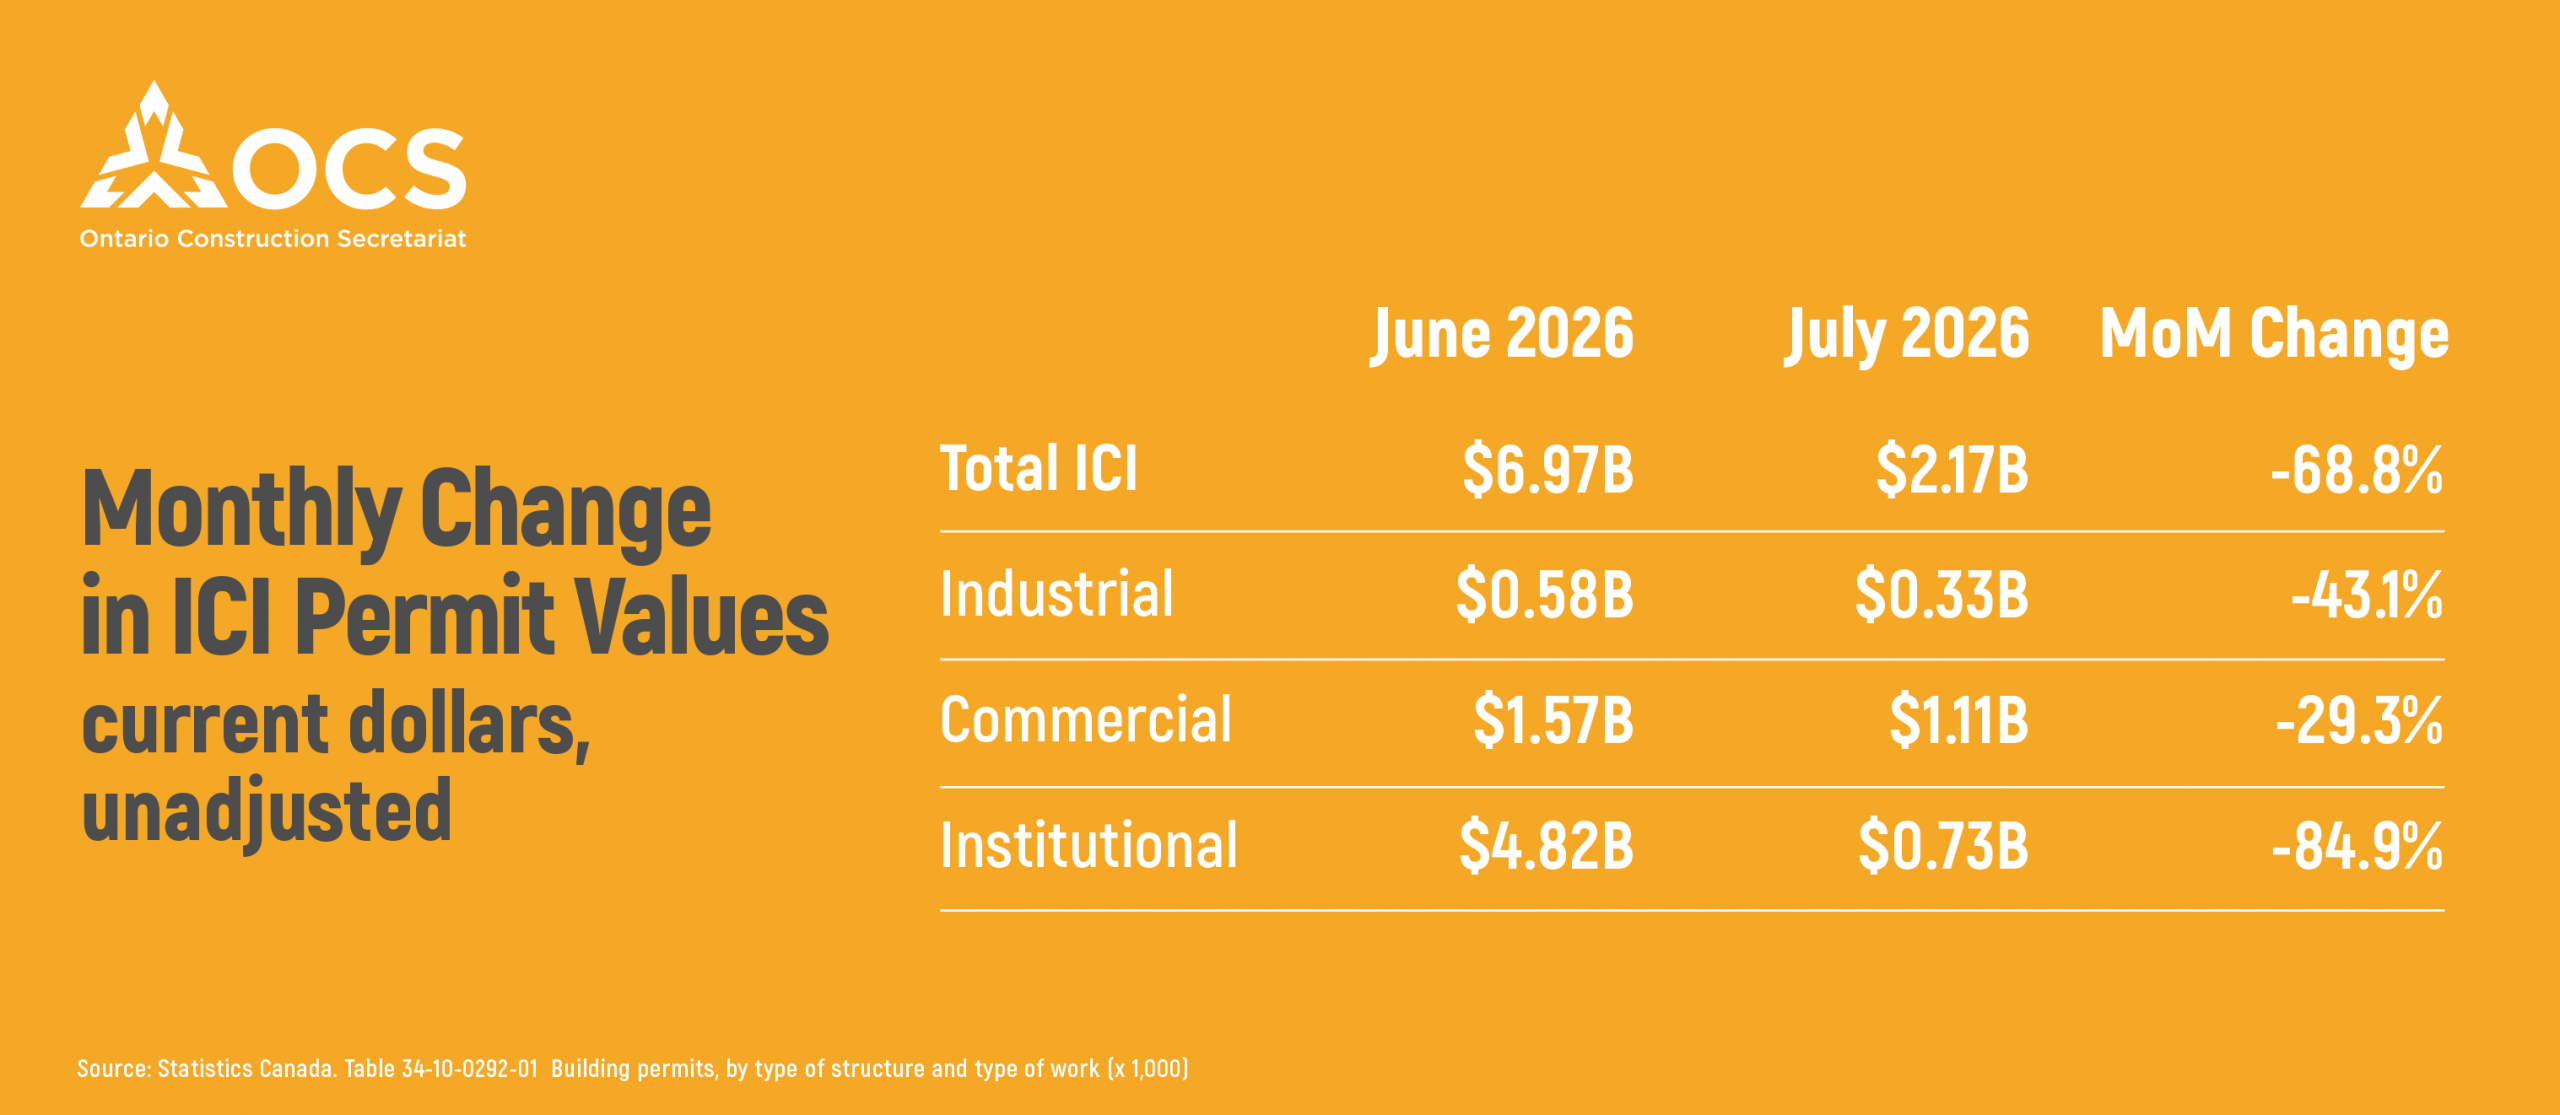
Ontario’s total ICI building permit value reached $2.17 billion in July 2026, down 68.8% from $6.97 billion in June.
Permit values declined across all three ICI sectors, but the largest change came from institutional construction. Institutional permits had reached a record $4.82 billion in June, largely due to a major medical project in the Toronto CMA. In July, institutional permit values returned to $0.73 billion.
The July decline should therefore be viewed in the context of an unusually strong June. At $2.17 billion, total permit activity returned closer to levels typically seen in recent months.
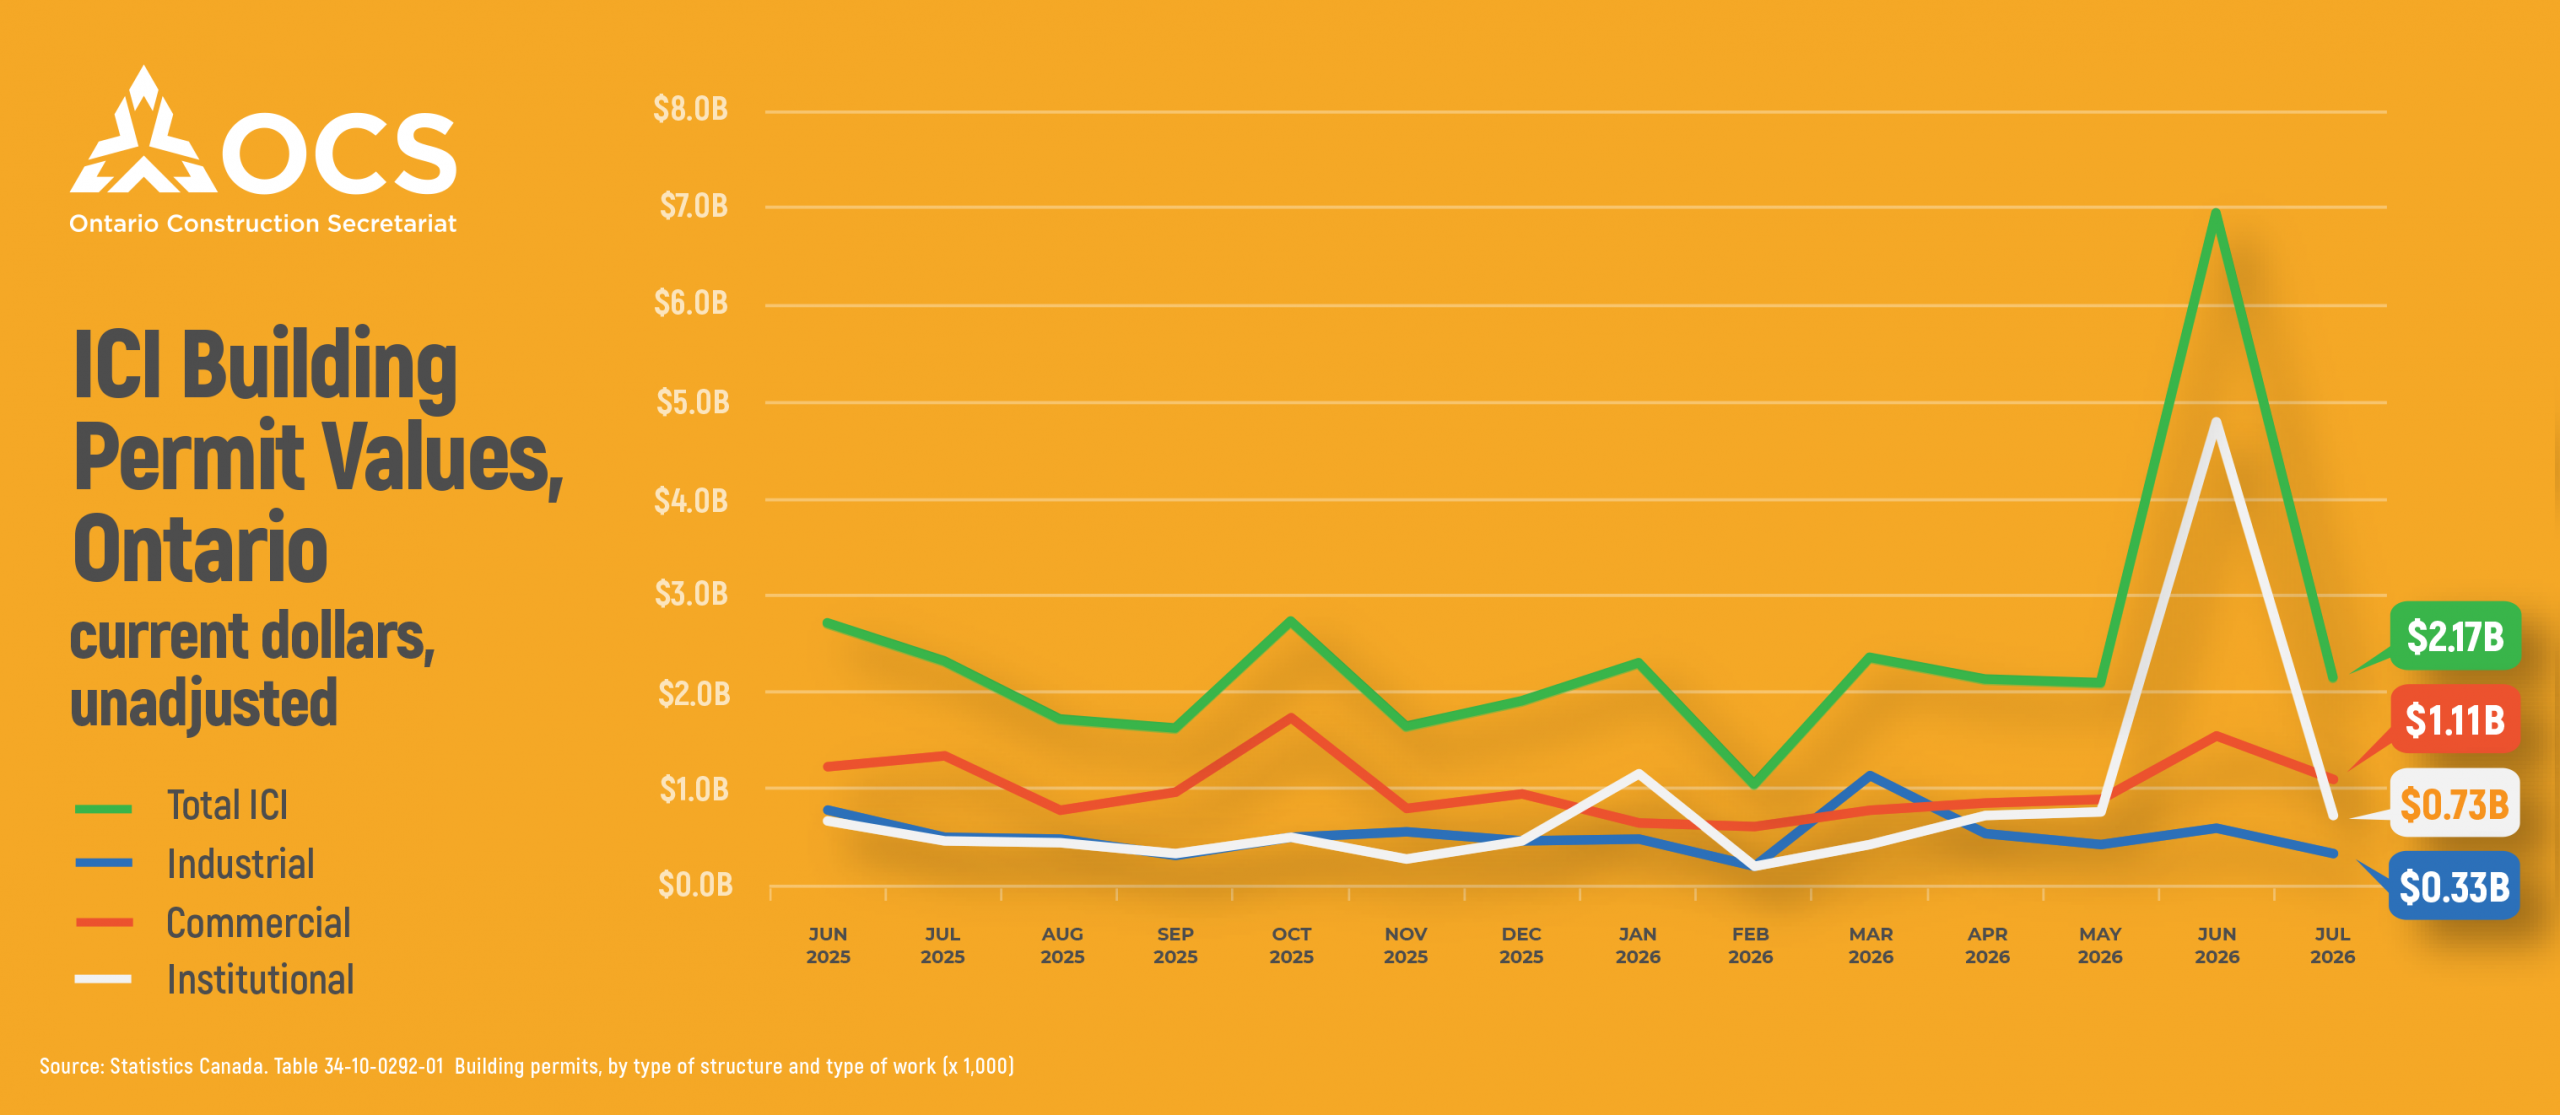
Commercial construction recorded $1.11 billion in permits in July, down 29.3% from June. Industrial permit values fell 43.1% to $0.33 billion.
Compared with July 2025, when ICI permit values were approximately $2.33 billion, July 2026 was about 6.9% lower.
 REGIONAL HIGHLIGHTS
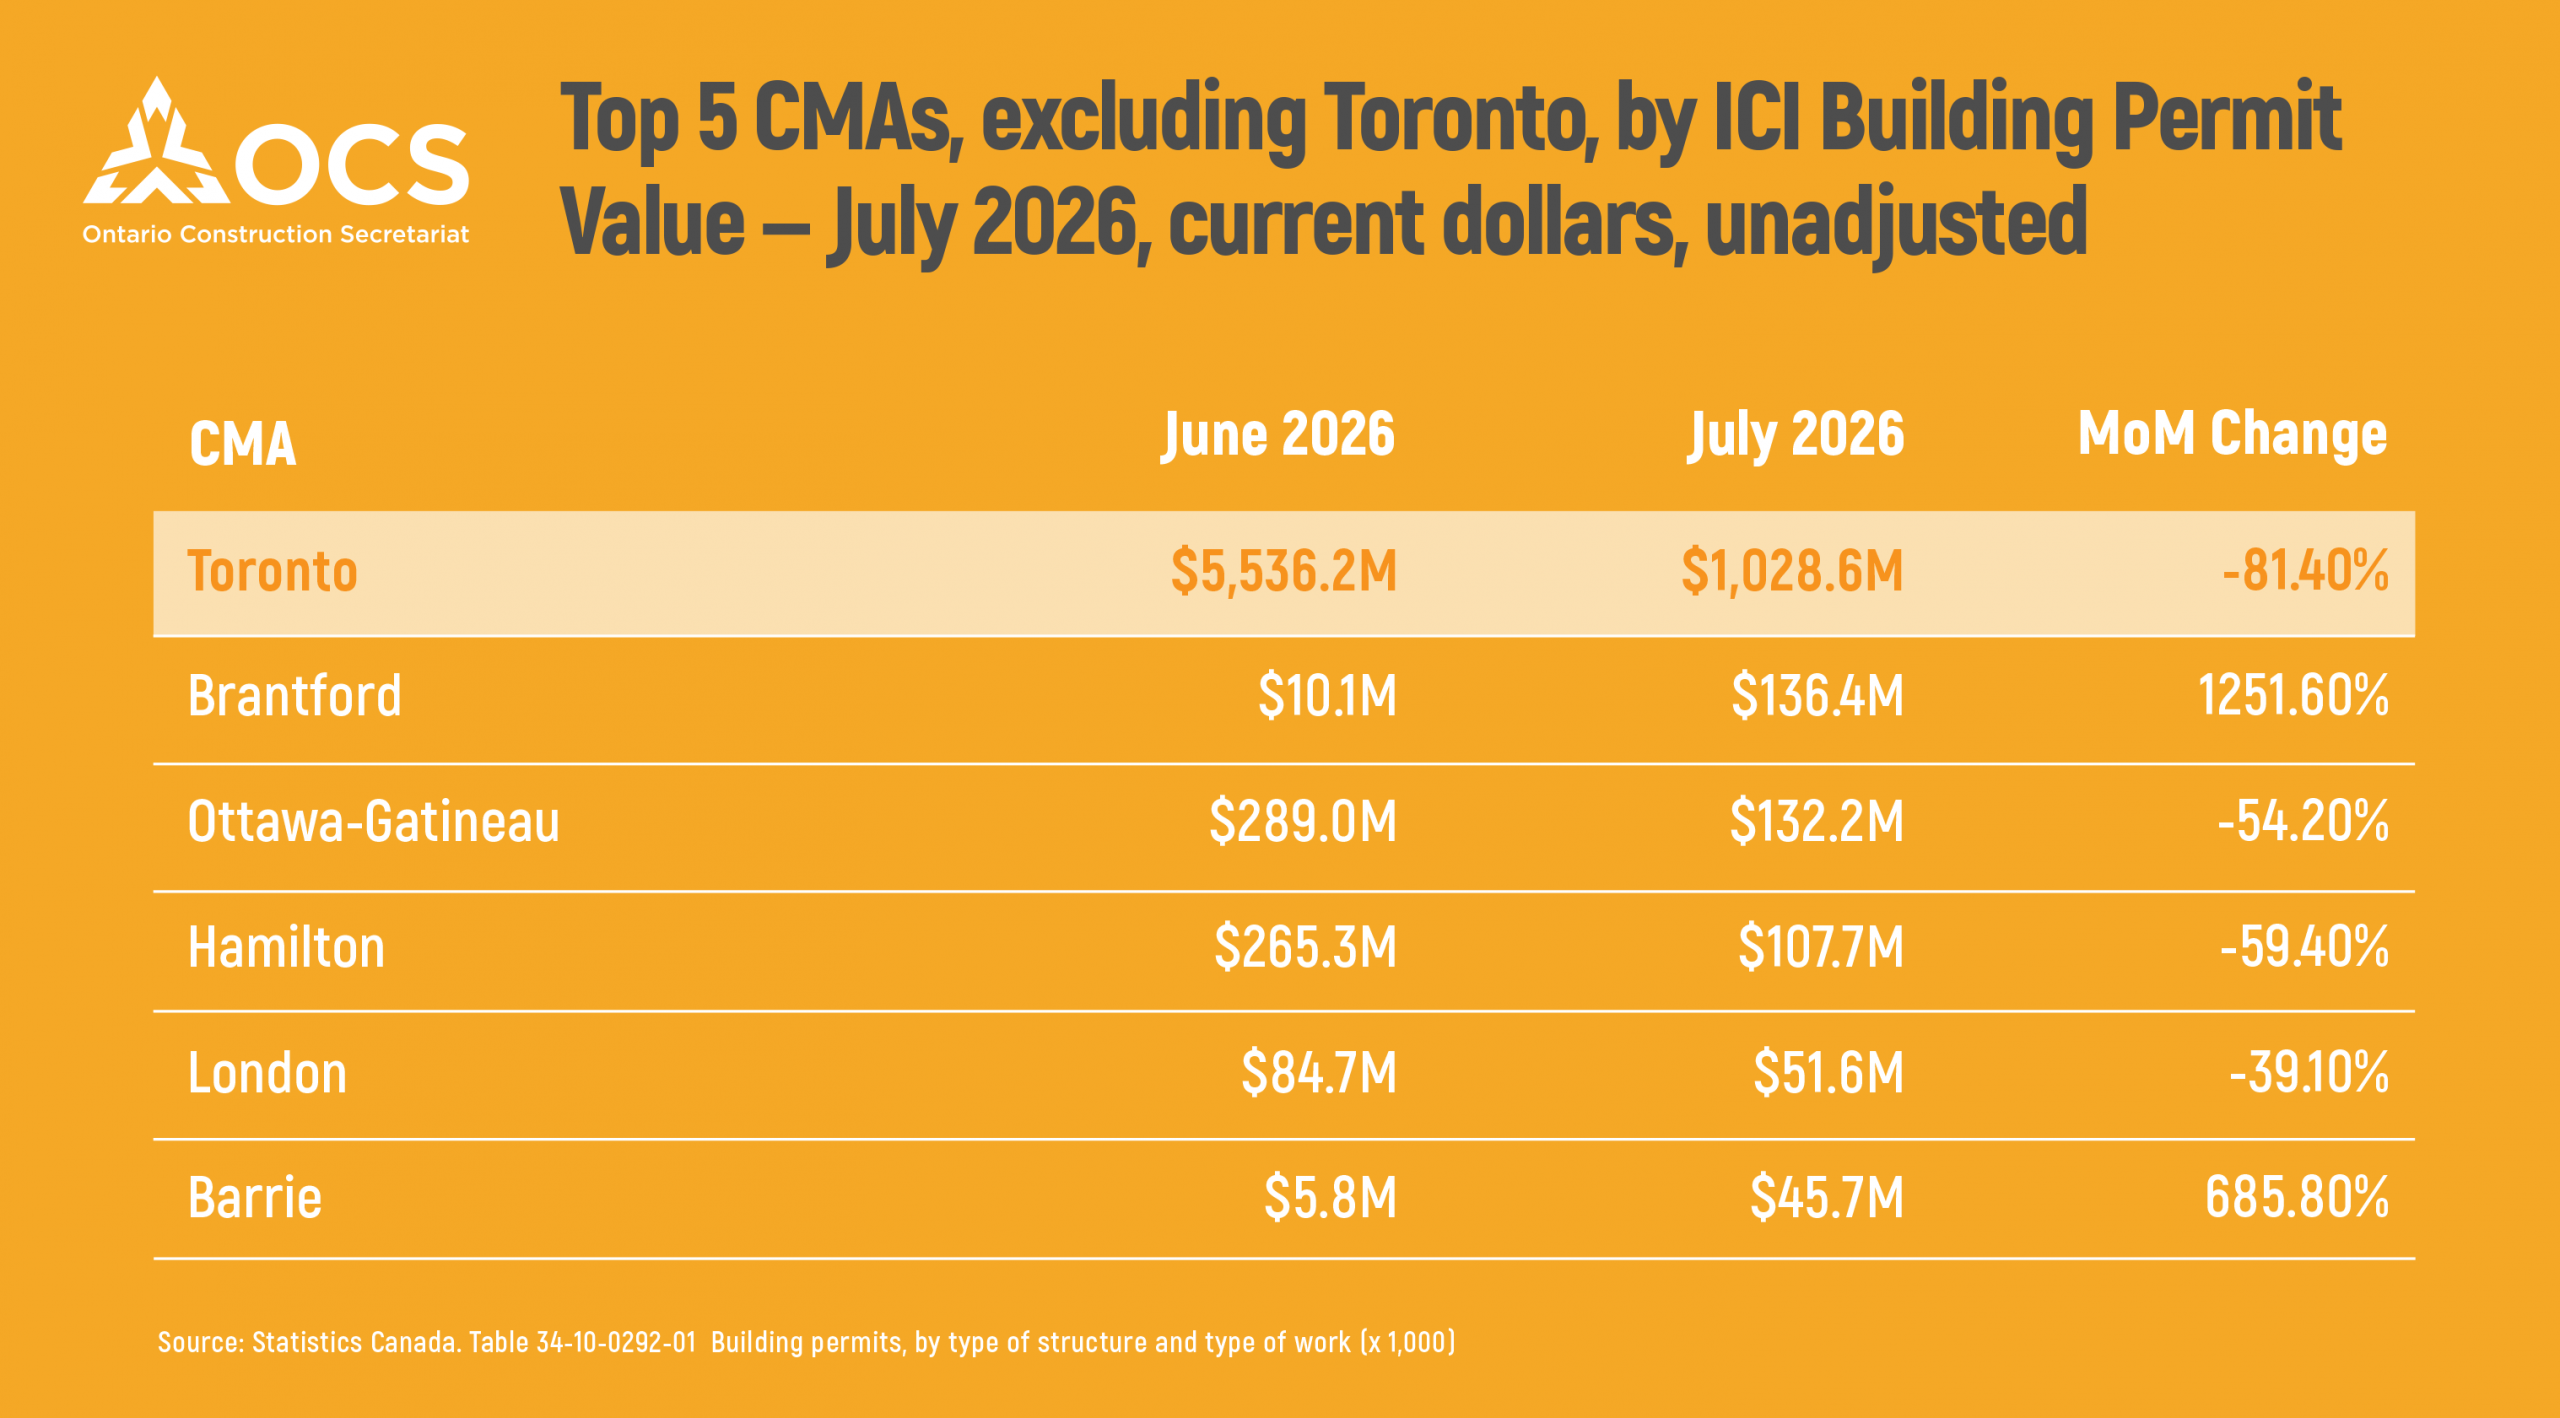
Toronto recorded $1.03 billion in ICI building permits in July. This was down 81.4% from June, when activity was boosted by the major institutional project. Despite the monthly decline, Toronto’s July permit value was approximately 5% higher than a year earlier.
Outside Toronto, Brantford recorded the highest ICI permit value in July at $136.4 million, up sharply from $10.1 million in June. This represented the largest percentage increase among the CMAs shown below. Brantford was followed by Ottawa-Gatineau at $132.2 million. Commercial projects accounted for the largest share of activity in both CMAs.
Barrie also recorded a notable increase. Permit values rose from $5.8 million in June to $45.7 million in July, an increase of 685.8%.
Meanwhile, some CMAs recorded significant monthly declines. The largest relative decreases were seen in Thunder Bay, Toronto, Windsor and Belleville-Quinte West.
WHAT IS BEING BUILT?
Commercial construction accounted for the largest share of ICI permit activity in July, representing 51.2% of the provincial total. Institutional construction accounted for 33.7%, while industrial construction represented 15.1%.
Trade and services buildings recorded the highest permit value among building types at $274 million. This was only about $1.6 million below June and remained high compared with monthly levels seen over the past few years. Retail and wholesale outlets accounted for approximately 66% of permits within this category.
Recreation buildings followed closely at $269.7 million, with indoor recreational facilities accounting for most of the activity.
Schools and educational buildings were the third-largest category at $268.4 million, although permit values were about 38% lower than in June. Office building permits also remained relatively strong at $255.4 million.
At the other end of the spectrum, laboratories, religious buildings and service stations recorded some of the lowest permit values among building types in July.
____________________________
FOR MORE INFORMATION, CONTACT:
Gargi Bharti
Economic and Research Project Lead
Ontario Construction Secretariat (OCS)
180 Attwell Drive, Suite 360, Toronto, ON M9W 6A9
P 416.620.5210
gbharti@iciconstruction.com