

September 24, 2026
SUMMARY
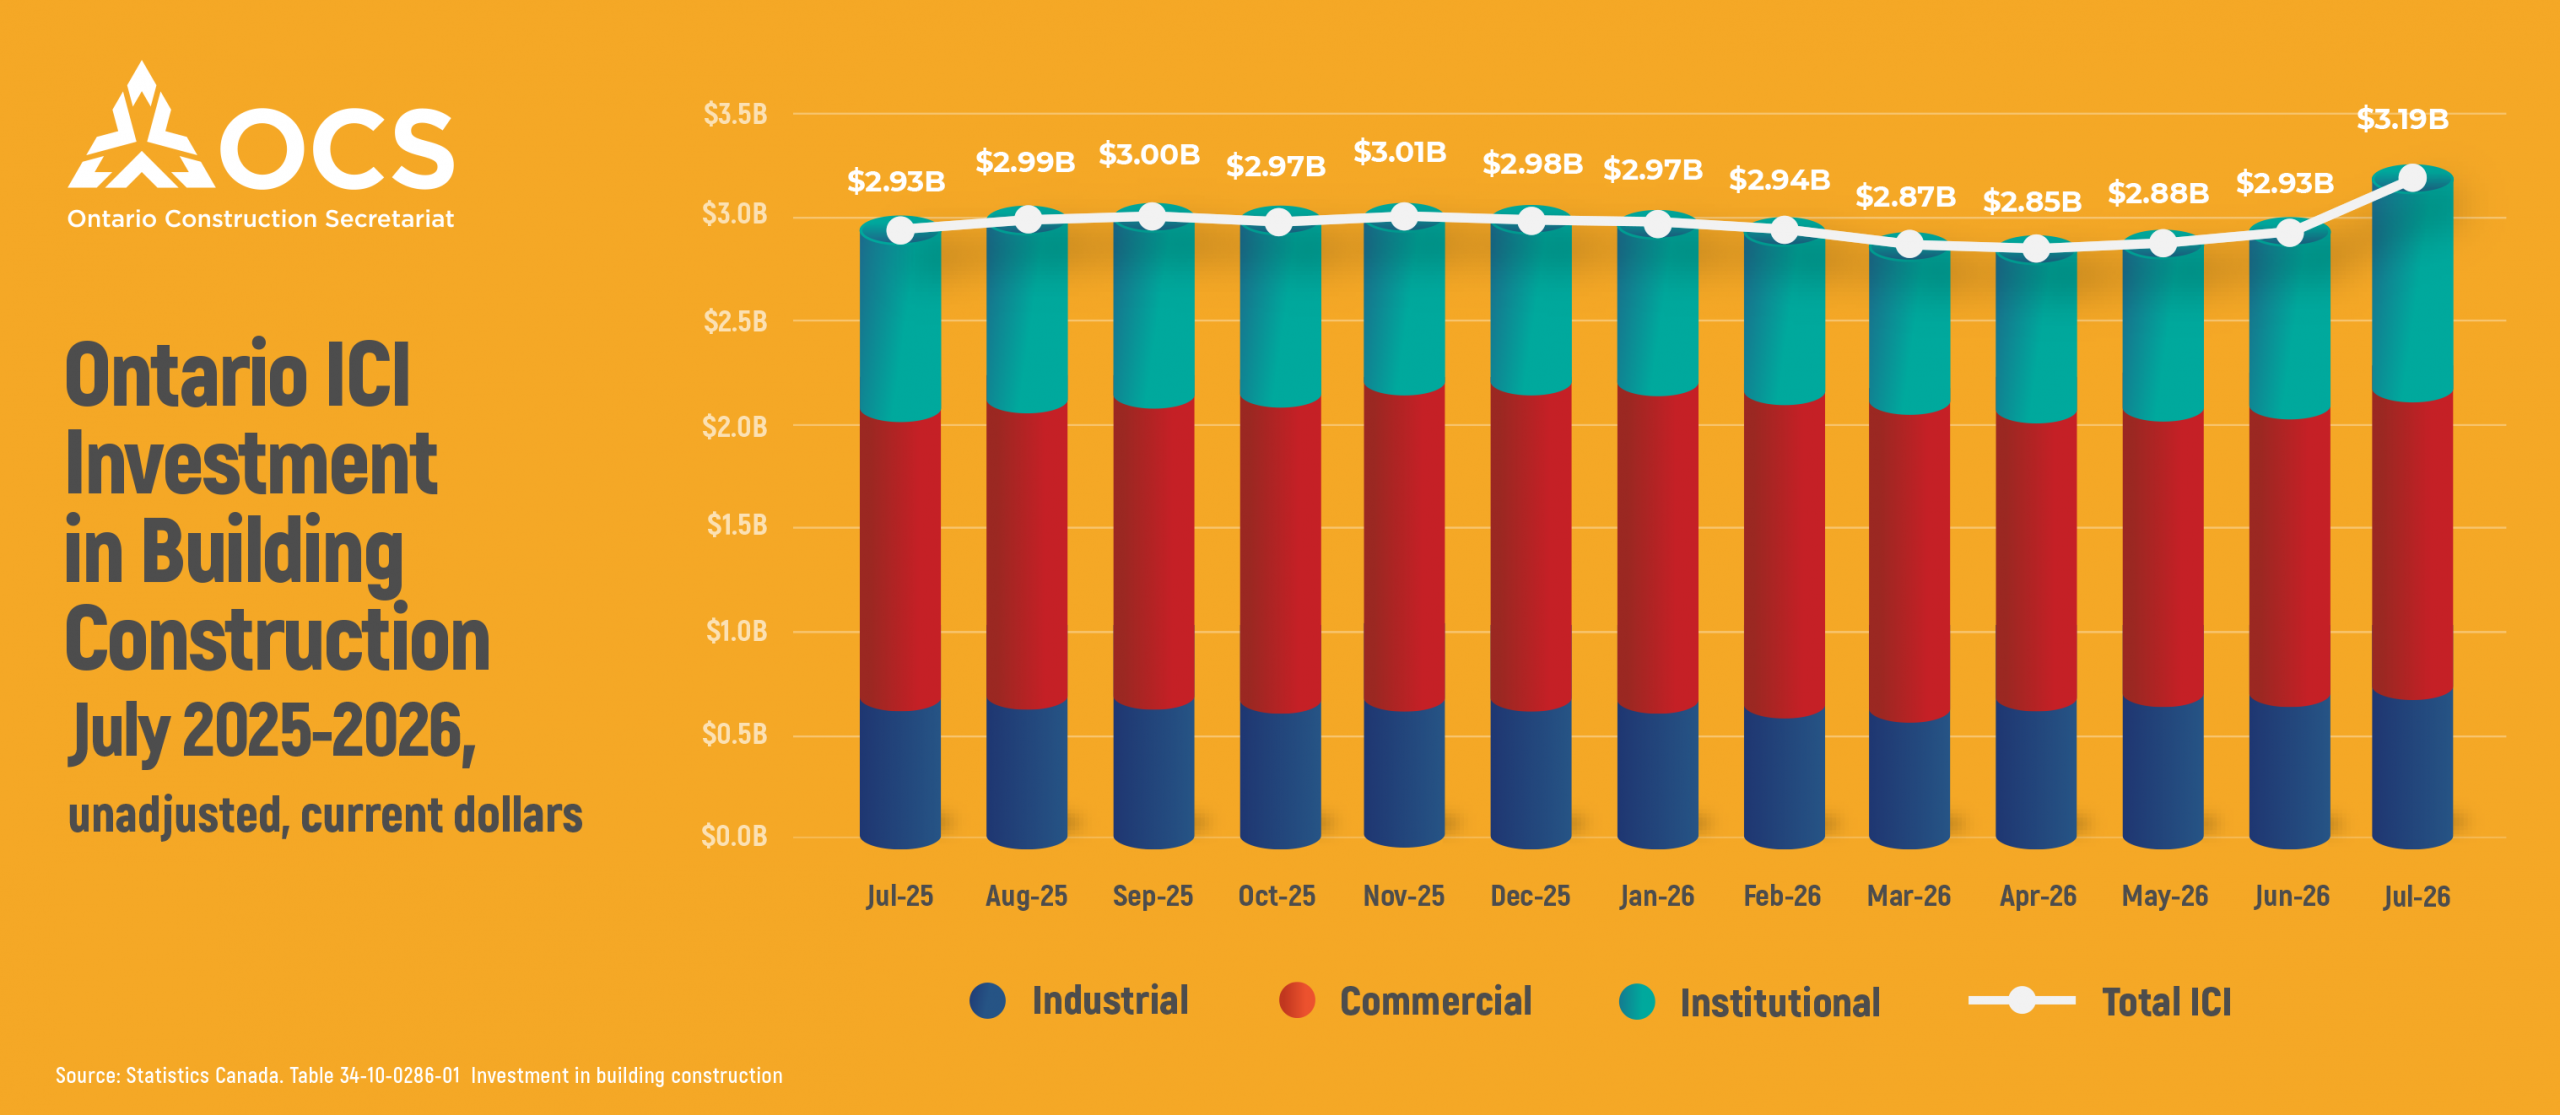
Ontario’s industrial, commercial and institutional (ICI) construction investment reached $3.19 billion in July 2026, up 8.9% from June and 8.7% from a year earlier.
Investment increased across all three ICI sectors on both a monthly and annual basis. Institutional construction recorded the strongest growth, while commercial construction continued to account for the largest share of total investment.
PROVINCIAL OVERVIEW
Total investment in Ontario’s ICI construction sector reached $3.19 billion in July 2026, increasing 8.9% from the previous month and 8.7% from July 2025.
Commercial construction continued to account for the largest share of investment at $1.44 billion, representing 45.2% of the total. Institutional construction followed at $1.02 billion, or 31.9%, while industrial investment reached $730 million, accounting for the remaining 22.9%.
All three sectors recorded higher investment compared with June. Institutional construction led the increase, rising 21.3%, followed by commercial investment at 4.5% and industrial investment at 3.1%.
Growth was also broad-based compared with a year earlier. Institutional investment increased 19.0% from July 2025, while industrial investment rose 7.1% and commercial investment increased 3.2%.
PERFORMANCE BY BUILDING TYPE
Office buildings remained the largest building category in July, followed by schools and warehouses.
Investment in office buildings reached $464.8 million, accounting for 14.5% of total ICI investment and 32.2% of commercial construction investment. Office investment increased 1.7% from June but remained 1.9% below its July 2025 level.
Warehouse investment reached $324.2 million, up 9.6% from the previous month and 28.5% from a year earlier.
Laboratory construction remained a relatively small category but continued to record the strongest annual growth. Investment reached $15.6 million, about 180% higher than in July 2025.
Within the industrial sector, factory construction recorded the highest investment at $310.2 million. This was 4.1% higher than in June and 4.8% above July 2025.
Investment in transportation-related buildings reached $213.3 million, down 2.0% from the previous month but up 18.1% from a year earlier. This was the strongest annual increase among the major industrial building types.
Institutional construction recorded the strongest overall sector growth in July. Schools and educational buildings remained the largest institutional category, with investment reaching $403.8 million. This was up 9.7% from June and 1.4% from a year earlier. Strong school construction activity continued in Toronto, London, Ottawa-Gatineau, Kitchener-Cambridge-Waterloo, St. Catharines-Niagara and Oshawa.
Hospital construction also increased sharply. Investment in medical buildings and hospitals reached $298.8 million, nearly double the previous month’s level. Compared with July 2025, investment was up 123.2%, the second-highest annual growth rate among all building types after laboratories.
Investment in welfare homes reached $193.0 million, down 3.0% from the previous month.
INVESTMENT TRENDS BY CENSUS METROPOLITAN AREA (CMA)
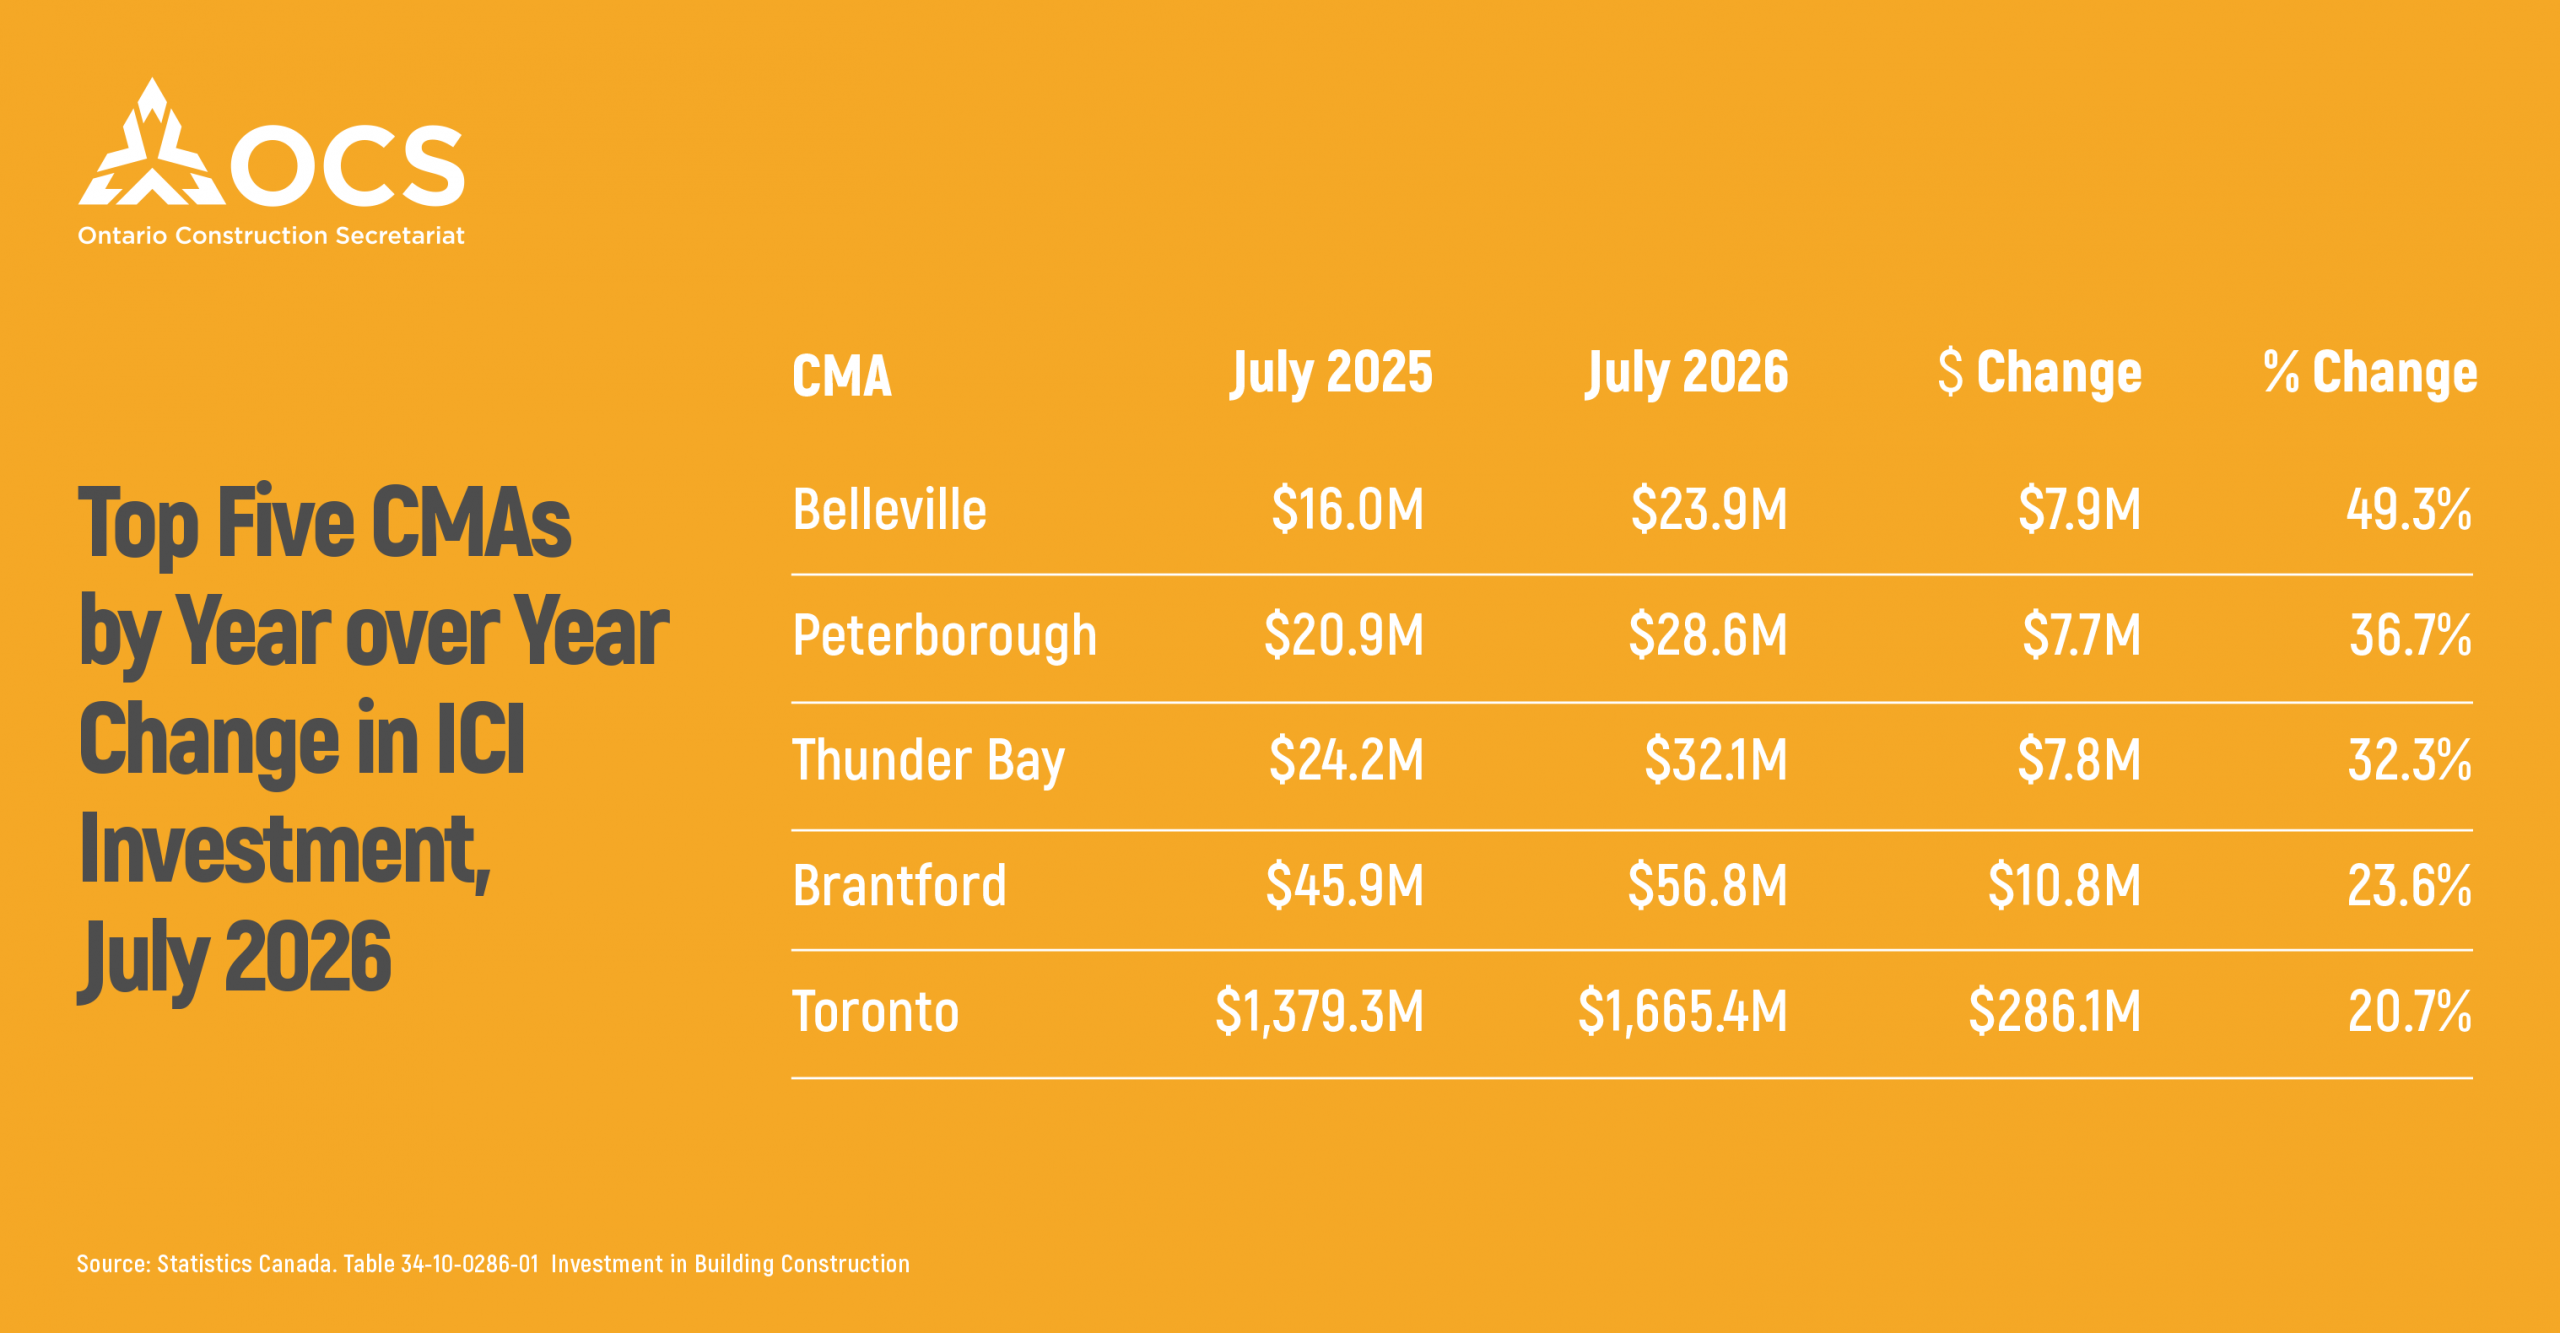
Several Ontario CMAs recorded strong year-over-year growth in ICI construction investment in July. Belleville recorded the largest increase at 49.3%, largely driven by commercial construction, particularly recreation facilities. Peterborough and Thunder Bay followed with increases of 36.7% and 32.3%, respectively, while Brantford rose 23.6% and Toronto increased 20.7%.
The drivers of growth varied across these markets. Peterborough’s increase was mainly driven by institutional construction, particularly schools and educational buildings, while Thunder Bay’s growth was led by industrial projects. Brantford recorded growth across all three ICI sectors, led by commercial construction, while Toronto’s increase was largely driven by institutional projects.
At the other end, Kingston and Kitchener-Cambridge-Waterloo recorded the largest year-over-year declines, with investment falling 44.0% and 31.1%, respectively.
Monthly movements were more moderate. Toronto recorded the strongest increase in July, rising 14.1% from June, followed by Ottawa-Gatineau at 10.2%. Barrie recorded the largest monthly decline at 5.7%, followed by Thunder Bay at 2.2%.
In dollar terms, Toronto remained by far Ontario’s largest ICI construction market, with $1.67 billion in investment in July. Ottawa-Gatineau followed at $154.8 million, London at $145.7 million, Hamilton at $123.9 million and Kitchener-Cambridge-Waterloo at $105.2 million.
____________________________
FOR MORE INFORMATION, CONTACT:
Gargi Bharti
Economic and Research Project Lead
Ontario Construction Secretariat (OCS)
180 Attwell Drive, Suite 360, Toronto, ON M9W 6A9
P 416.620.5210
gbharti@iciconstruction.com