


November 19, 2026
SUMMARY
Ontario’s industrial, commercial and institutional (ICI) building permit values totalled $5.81 billion in Q3 2026, down 48.3% from the previous quarter. The decline was largely driven by lower institutional permit values following an exceptionally strong June. However, September saw a rebound in permit activity, led by the industrial sector.
PROVINCIAL OVERVIEW
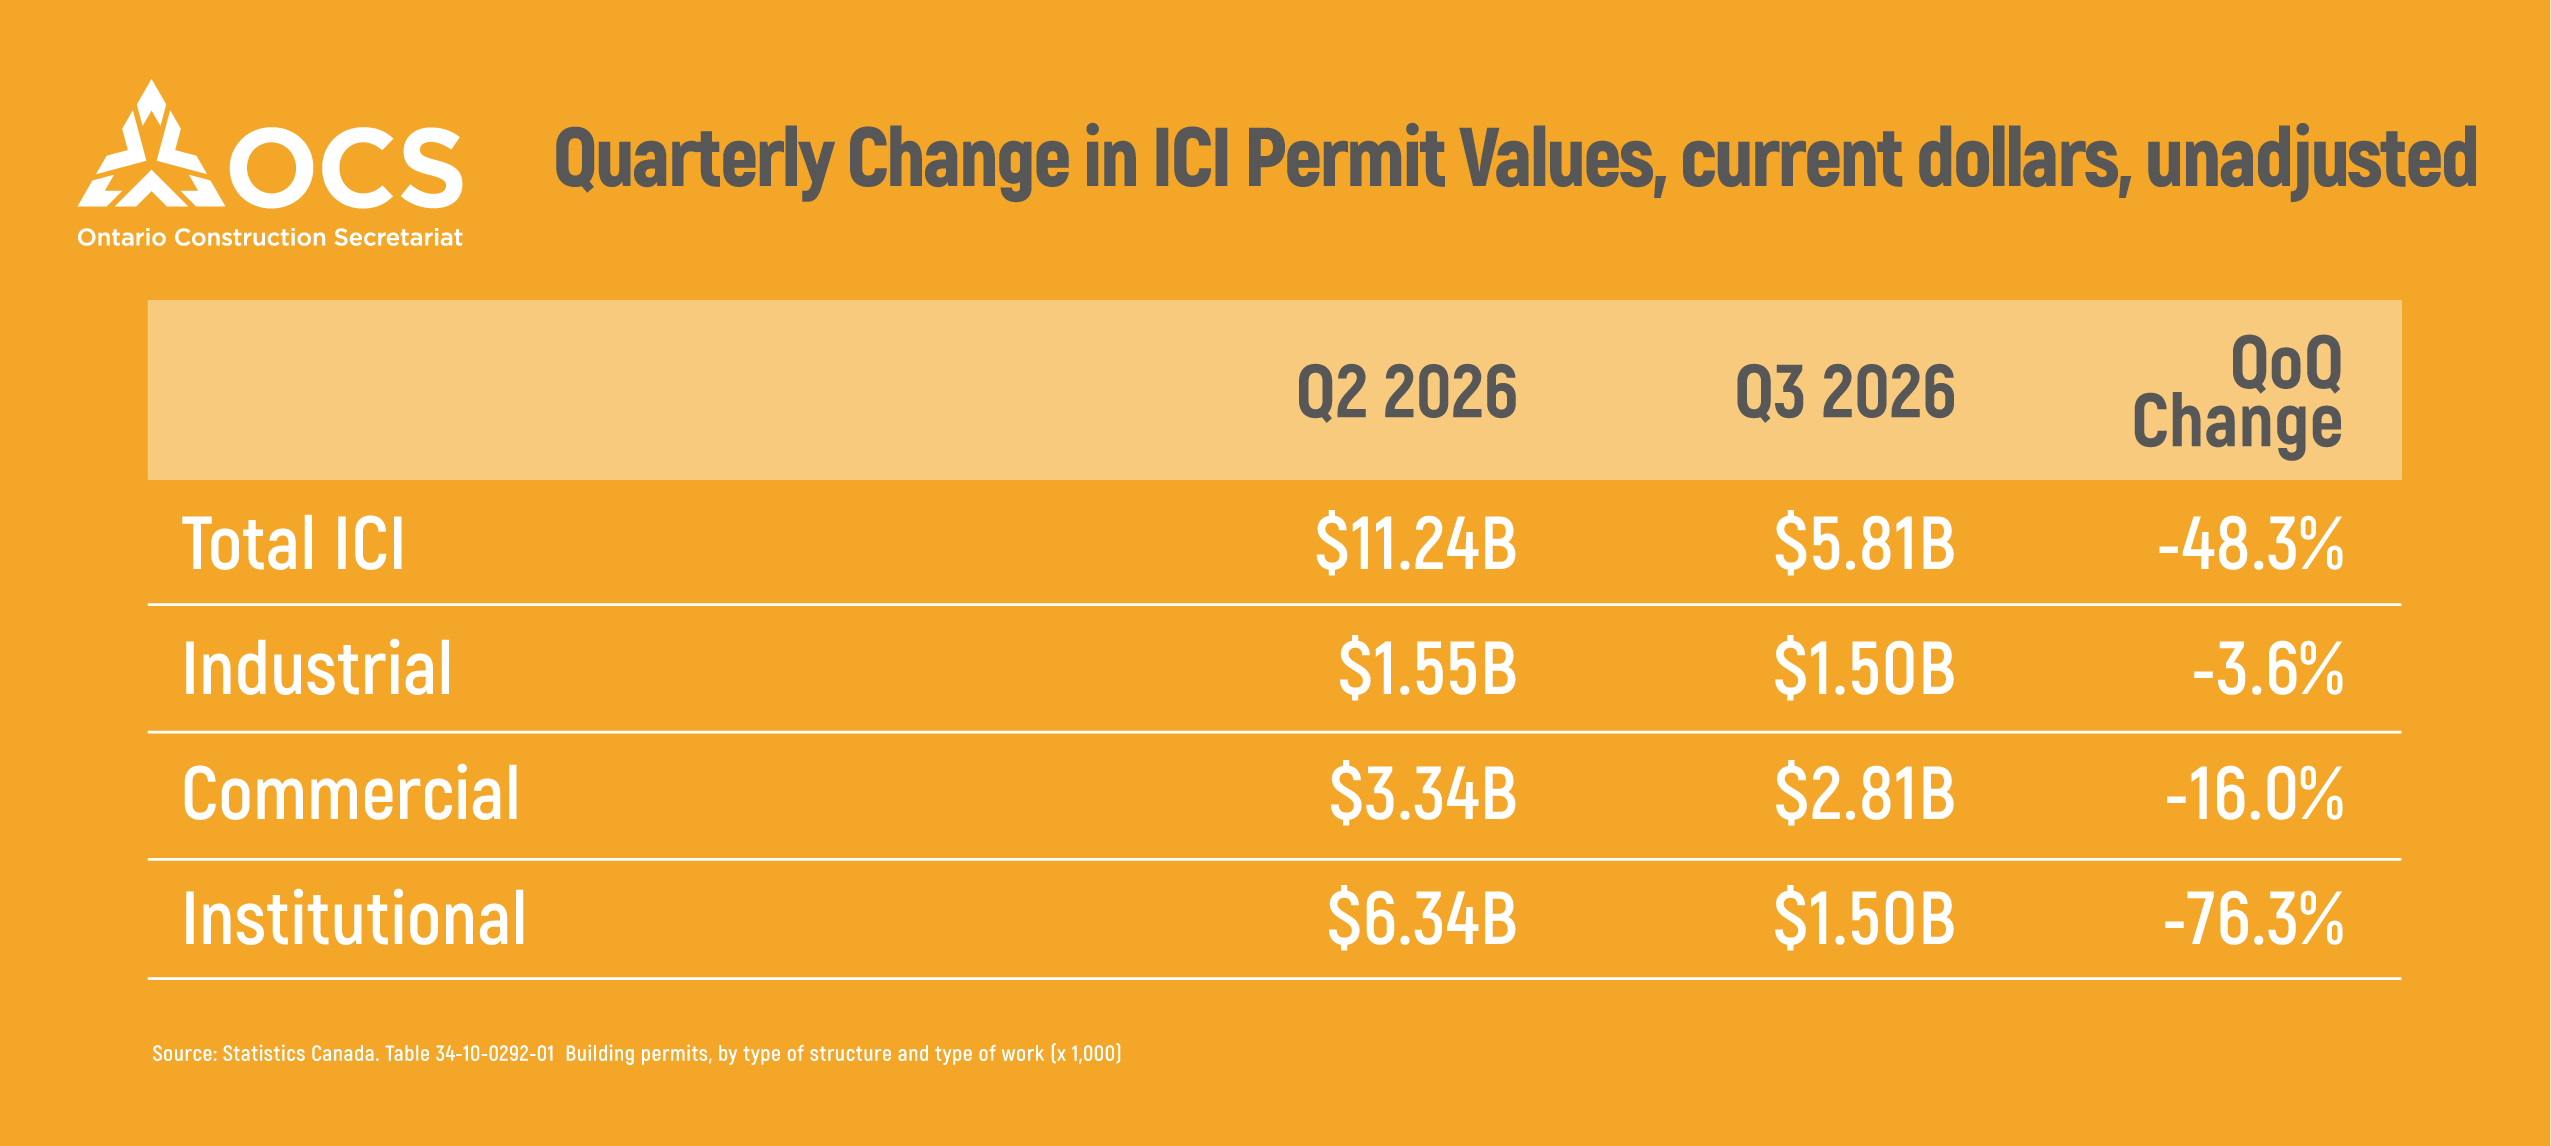
Ontario’s ICI building permit values declined from $11.24 billion in Q2 to $5.81 billion in Q3, with decreases across all three sectors.
Institutional permits recorded the largest decline, falling 76.3% to $1.50 billion. This followed a record $4.82 billion in institutional permits in June, largely driven by a major medical project in the Toronto CMA. That project contributed to Ontario’s total ICI permit value reaching $6.97 billion in June alone.
The sharp quarterly decline therefore largely reflects the unusually high Q2 figures rather than necessarily indicating a broad-based slowdown in permit activity.
Commercial permits declined 16.0% to $2.81 billion, while industrial permits edged down 3.6% to $1.50 billion.
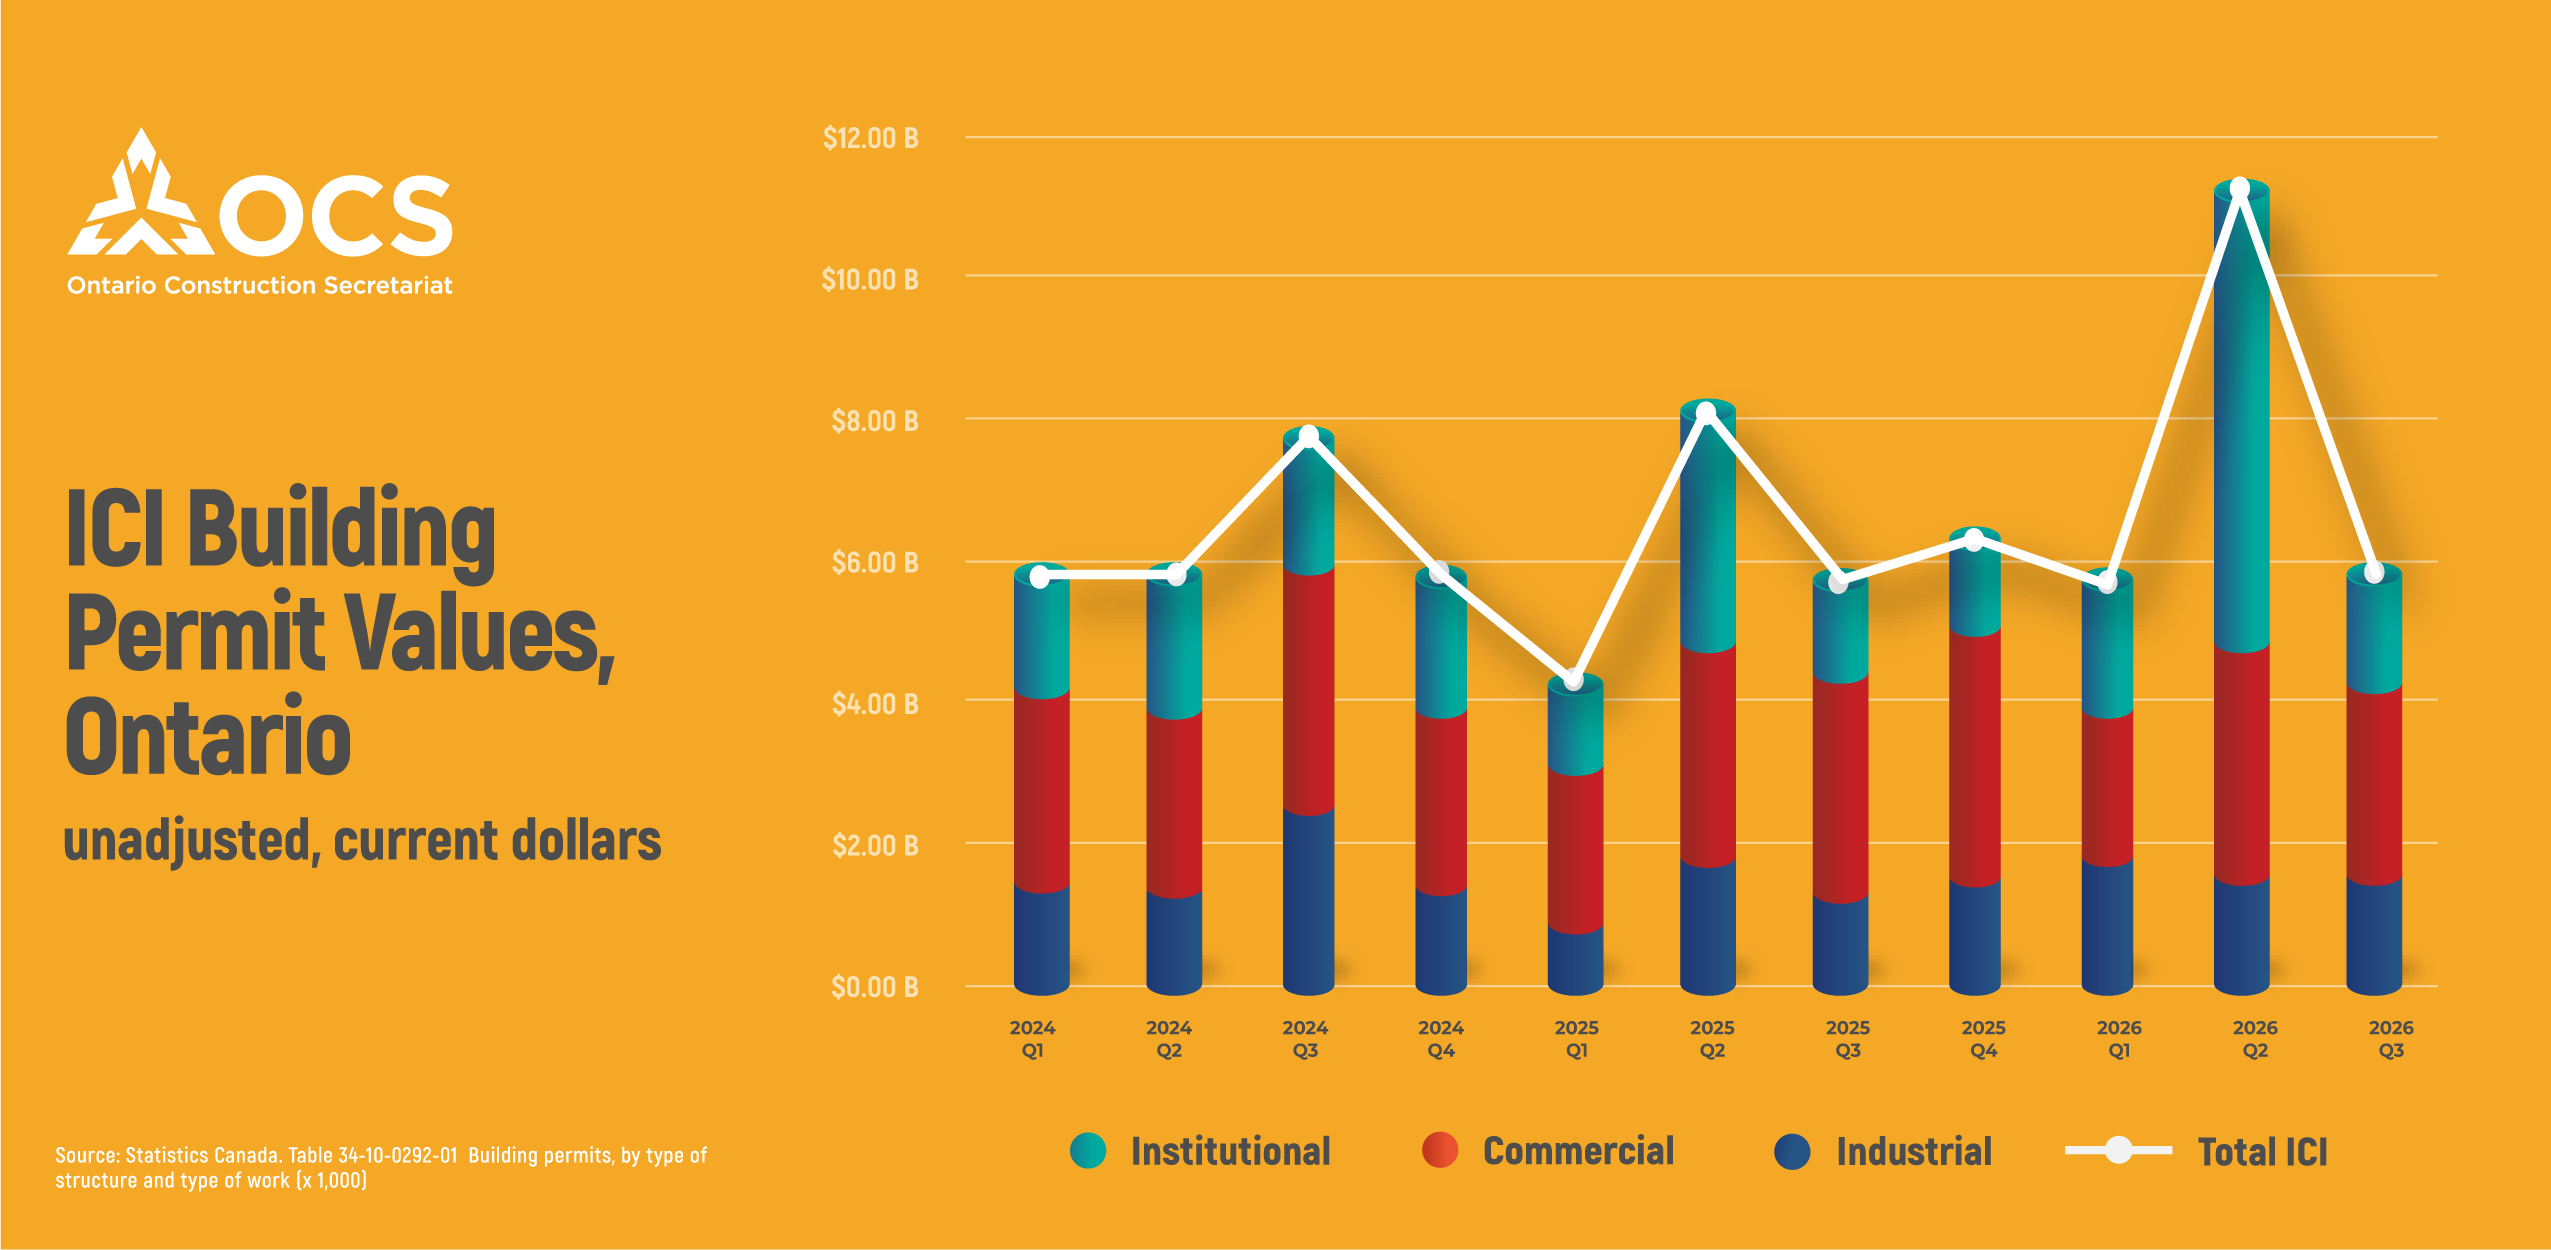
Despite the quarterly decline, September recorded a 36% monthly increase in total ICI permit values. Industrial permits led the growth, rising 137% to $824 million, their highest monthly value of Q3. Commercial permits increased 17% to $912 million, while institutional permits fell 11% to $362 million.
 REGIONAL HIGHLIGHTS
Toronto recorded $2.6 billion in ICI building permits in Q3. This was down 64% from Q2 and was 29% down from Q1. The decrease was largely driven by institutional permits.
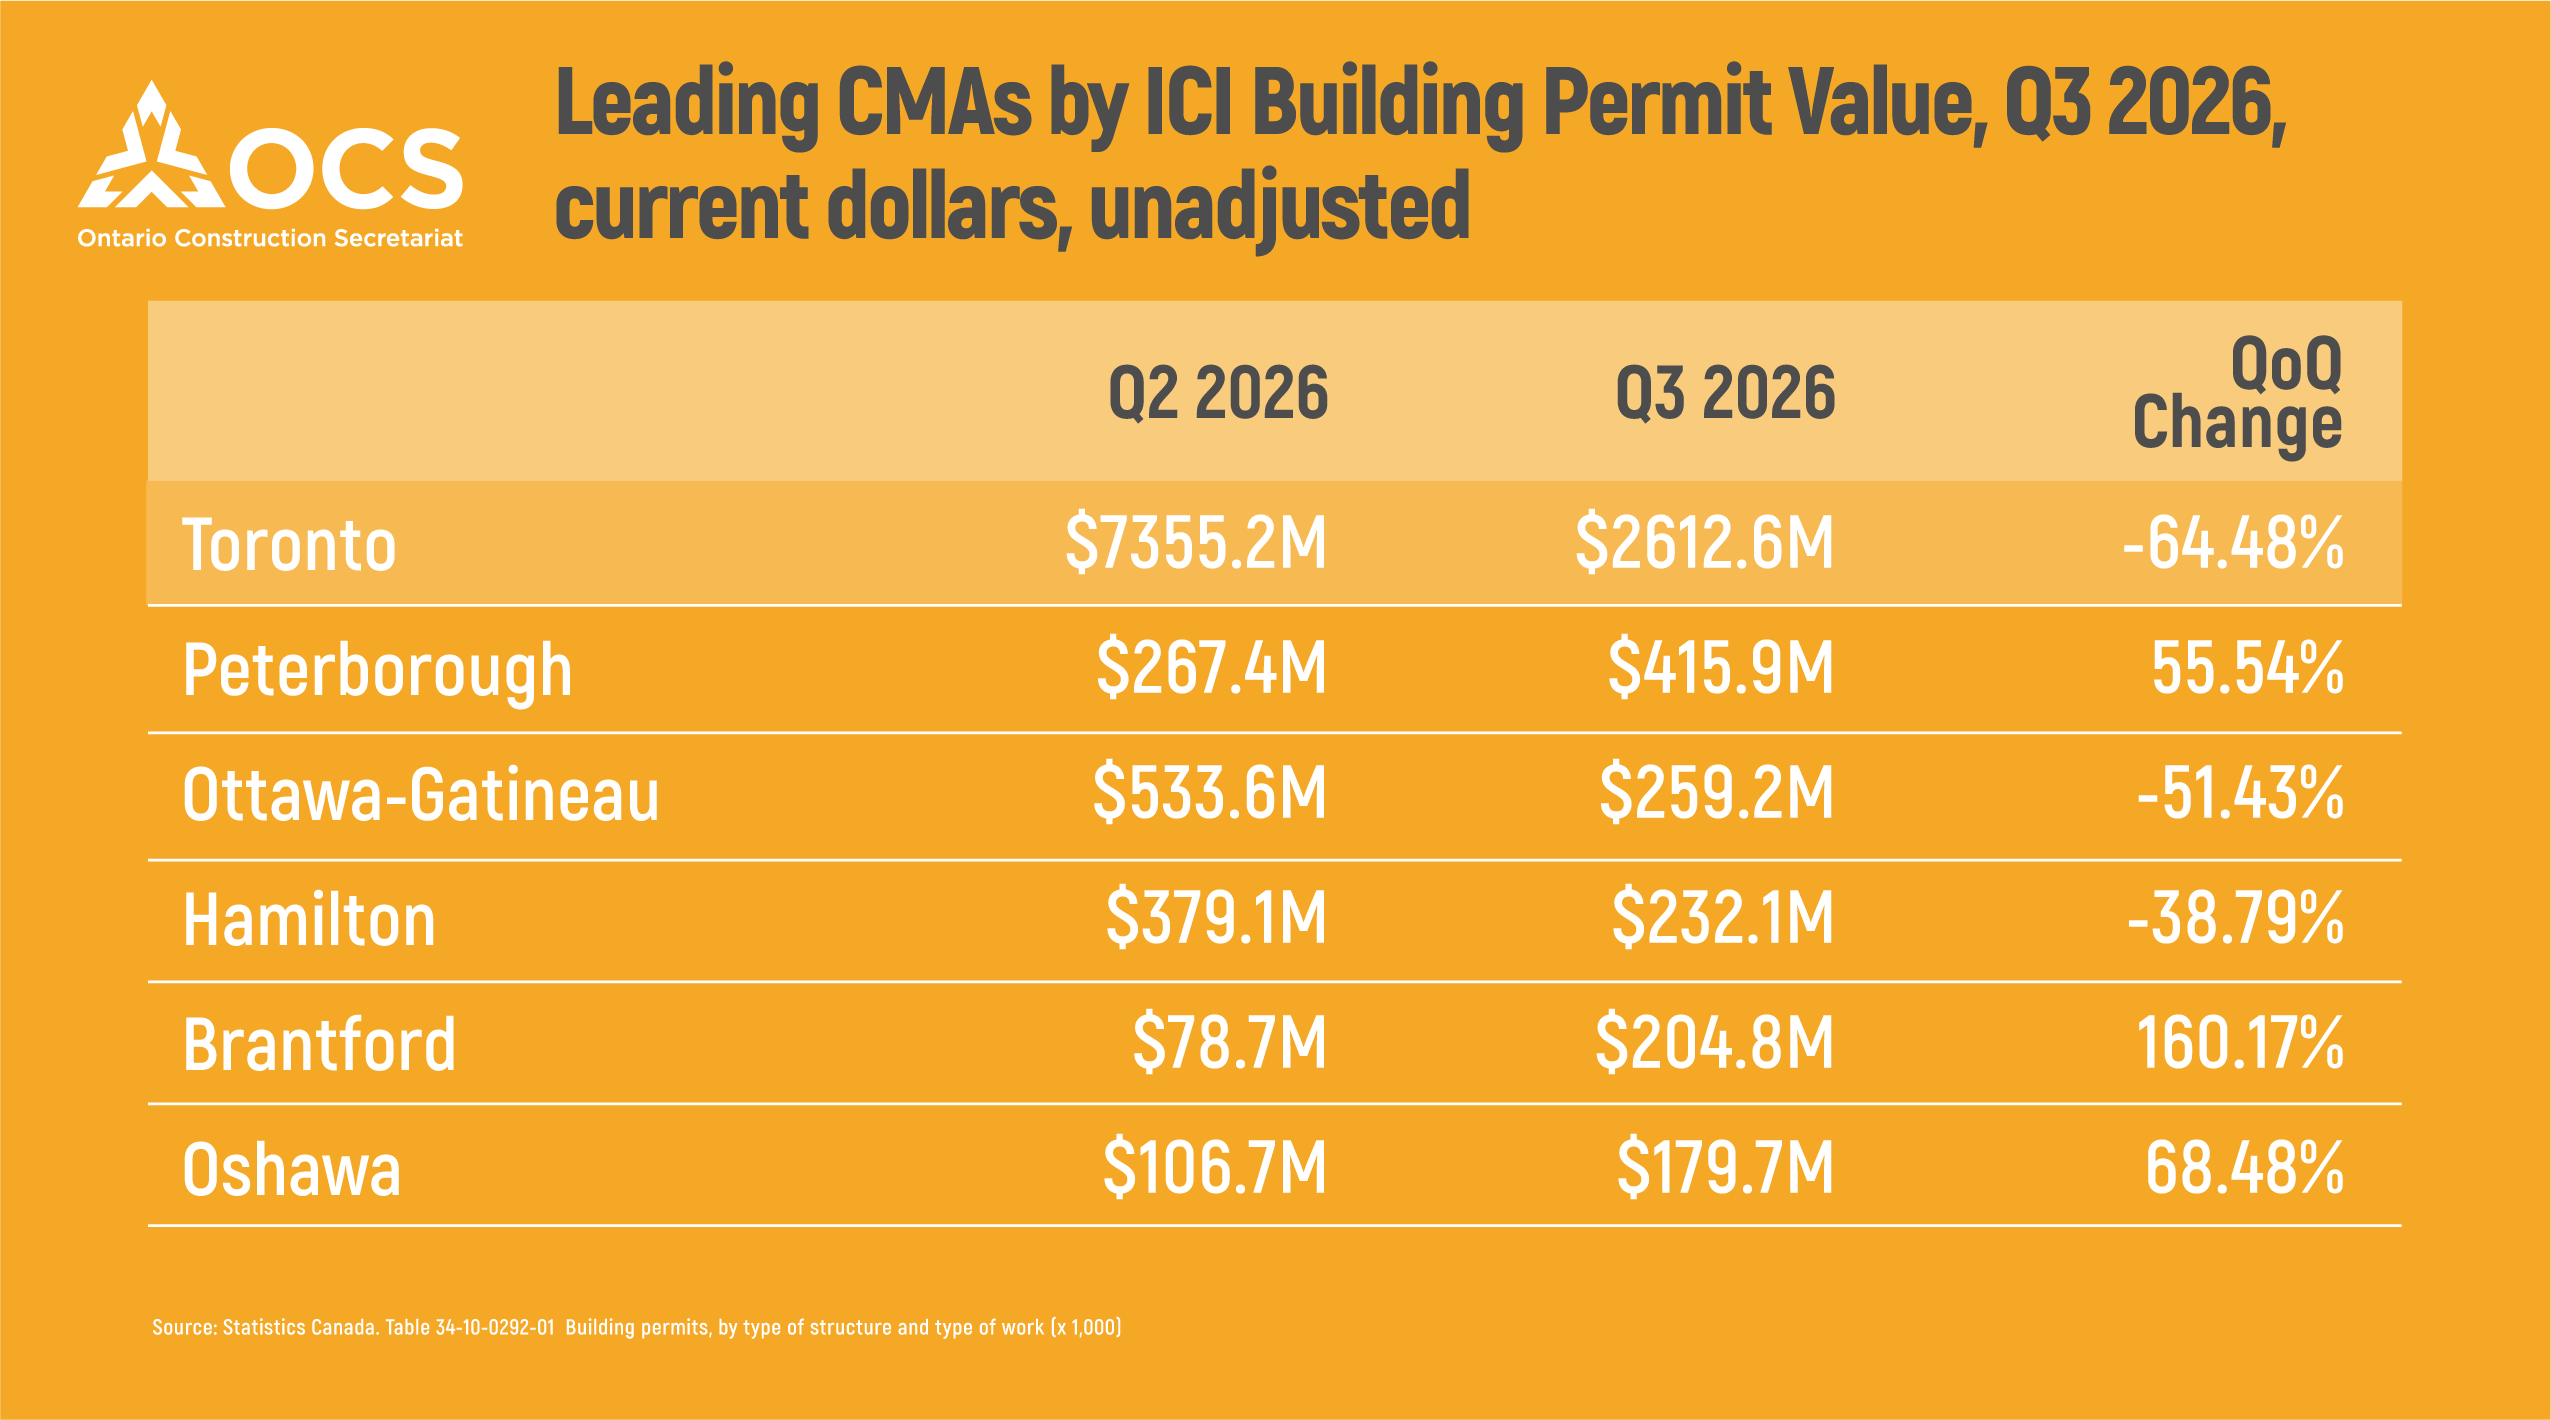
Toronto recorded $2.61 billion in ICI building permits in Q3, down 64.5% from Q2 and 29% from Q1. The decline was largely driven by lower institutional permit values. Despite this, Toronto remained the largest contributor to provincial permit activity.
Outside Toronto, Peterborough recorded the highest Q3 permit value at $415.9 million, almost entirely from September. Utility buildings accounted for approximately $406 million, representing 86% of Ontario’s total utility building permit value in September.
Ottawa-Gatineau followed at $259.2 million, primarily driven by commercial permits, while Hamilton recorded $232.1 million.
Barrie recorded the largest percentage quarterly increase, with permit values rising 163% to $109.7 million, driven by institutional construction. Brantford followed closely, increasing 160% to $204.8 million, placing it among the top five CMAs by total ICI permit value.
The largest relative quarterly declines were recorded in London, Toronto, Thunder Bay, St. Catharines-Niagara and Windsor.
 WHAT IS BEING BUILT?
Commercial construction accounted for the largest share of Q3 ICI permit values at 48%, while industrial and institutional construction each represented approximately 26%.
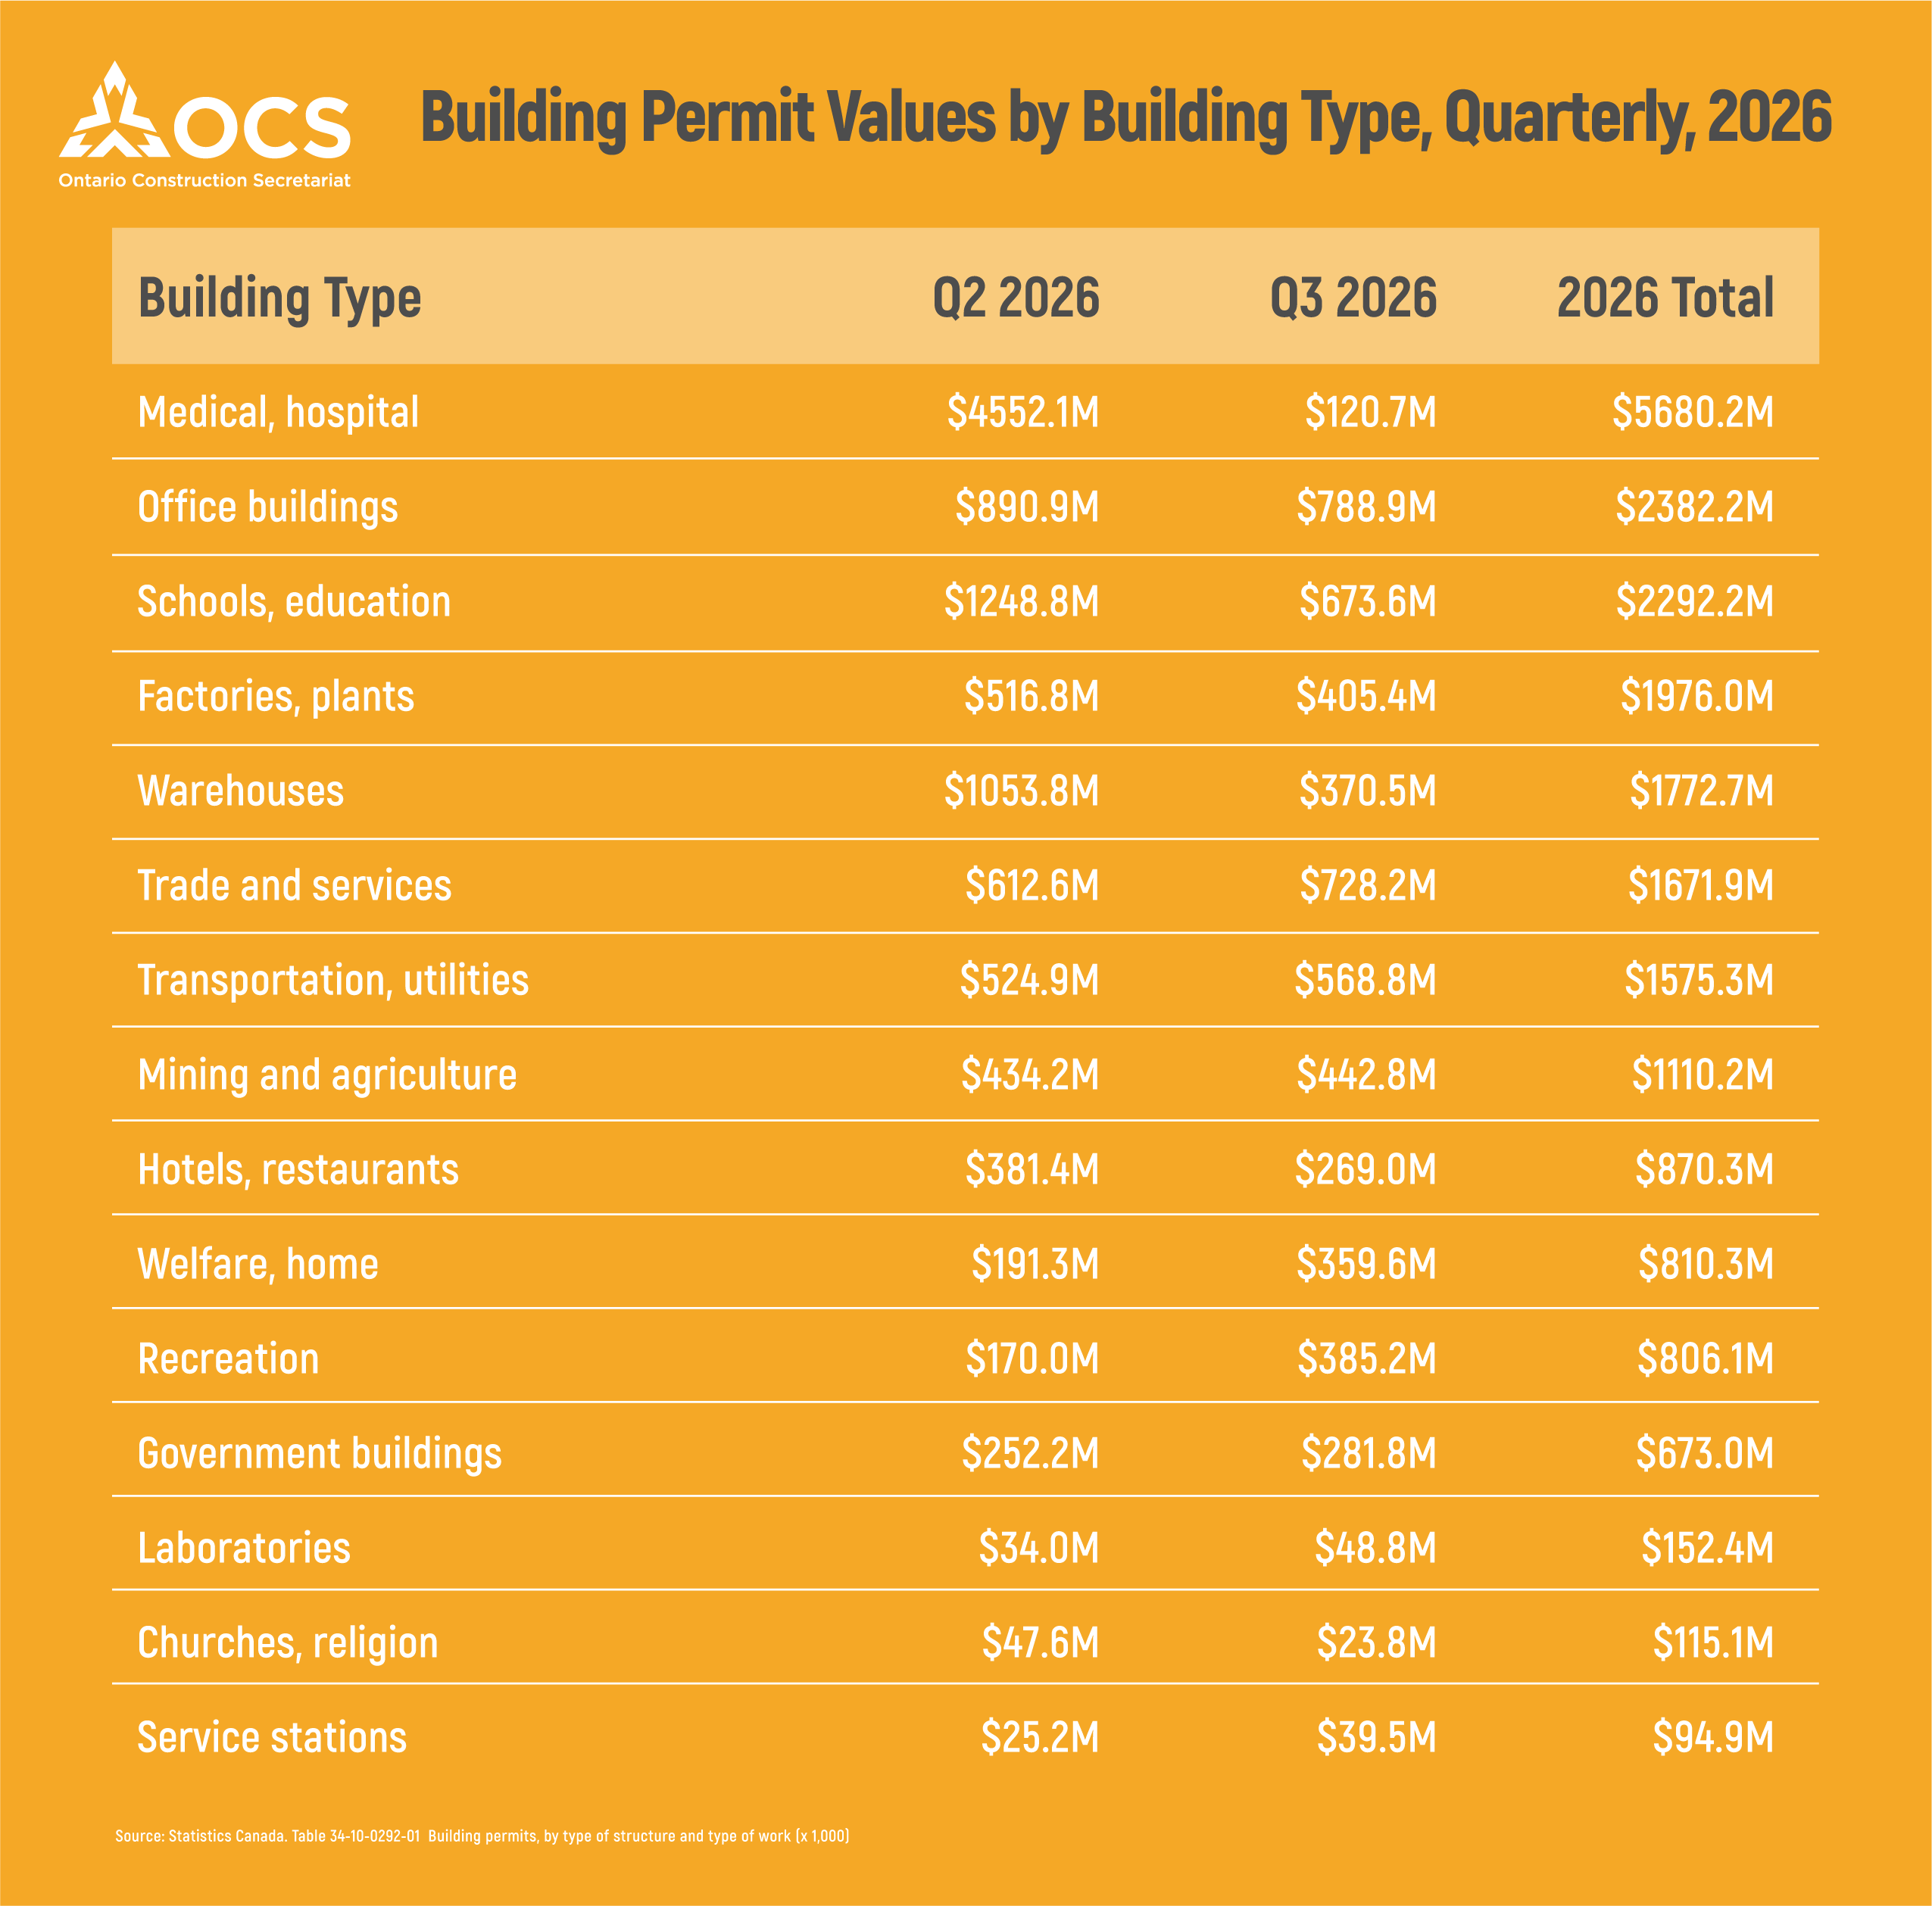
Office buildings led all building types, with $788.9 million in permits, down $102.1 million from Q2. Approximately 85% of this value was concentrated in Toronto.
Trade and services buildings followed at $728.2 million, an increase of $115.7 million from the previous quarter. Schools and educational buildings ranked third at $673.6 million, down 46% from Q2.
Transportation and utilities permits reached $568.8 million in Q3, up $43.9 million from Q2, with Peterborough accounting for approximately 71% of the quarterly total.
Activity varied considerably across building types. Recreational buildings recorded the largest relative increase, rising 126% to $385.2 million. In contrast, medical and hospital permits fell 97.3% to $120.7 million following exceptionally high second-quarter activity.
Despite this decline, medical and hospital buildings remained the largest category for 2026 year-to-date, with $5.68 billion in permits, followed by office buildings at $2.38 billion.
Overall, Q3 reflected a return to lower permit values following an unusually strong second quarter. While institutional activity declined sharply, commercial construction remained the largest contributor, and September’s industrial rebound provided a stronger end to the quarter.
____________________________
FOR MORE INFORMATION, CONTACT:
Gargi Bharti
Economic and Research Project Lead
Ontario Construction Secretariat (OCS)
180 Attwell Drive, Suite 360, Toronto, ON M9W 6A9
P 416.620.5210
gbharti@iciconstruction.com